All posts by Waterblogger

The author has 35 years of environmental experience primarily with oil and gas and mining development, abandoned mines, and water issues in the private and public sector. A colleague once described the author as being a member of every weird water group in the West. A former Department of the Interior employee, the author received the Department's highest award for Distinguished Service in 2015.

Waters of the United States

Warning: This is not a science post.

On December 11, 2018, the U.S. Environmental Protection Agency (EPA) and the U.S. Army Corps of Engineers made available their proposed rewrite of the 2015 “Clean Water Act Rule.” This revised rule will be posted in the Federal Register, however the EPA has already made it available on their website for advance review. The new revised Rule is entitled simply “Waters of the United States (WOTUS) Definition”, which is what this Rule was about from the beginning. I always thought that the previous title of “Clean Water Act Rule” was simply a ruse to confuse people about the intention of its contents.

The Clean Water Act (CWA) applies to “navigable waters of the United States.” The definition of what is a “navigable water of the United States” prior to 2015 was so obtuse that enforcement often ended up in litigation. Several of these cases have made their way to the Supreme Court for resolution.

EPA’s rewrite of the Rule in 2015 was supposed to clear up the inconsistencies in the application of the regulations. EPA’s idea at the time was to use science to define a “WOTUS.” The Agency conducted a science review of the physical, chemical and biologic connections between water bodies and used the resulting report in providing a definition. The problem is that the natural world is a messy sort of place where pretty much everything connects with everything else. The natural world does not fall into a neatly laid out legal scheme such as the Clean Water Act. So the 2015 Rule encompassed almost every drop of water in the United States into the definition of a “WOTUS.”

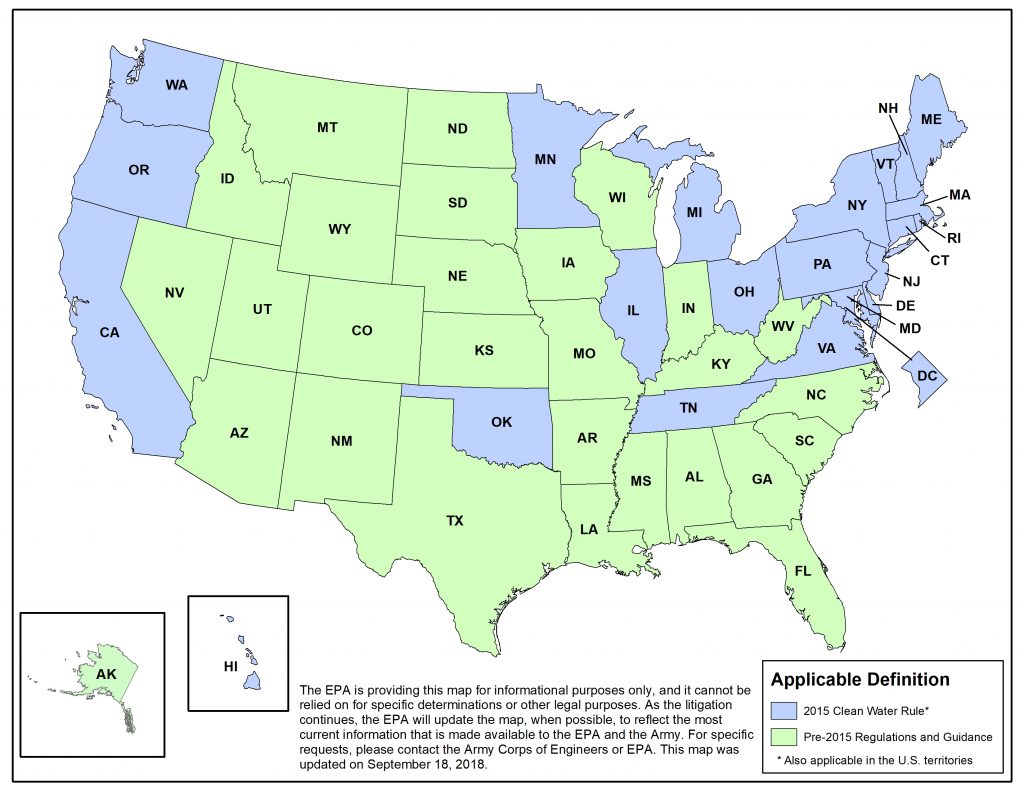
Back in 2015, I posted quite a bit on the “Clean Water Rule” (check out this link to read past posts https://waterblogger.org/water-quantity/a-review-of-the-environmental-protection-agencys-connectivity-of-streams-and-wetlands-to-downstream-waters-post-1/) and I have been following the subsequent litigation over that Rule. I would put the 2015 rule making process in the category of one of the most disastrous examples of federal regulatory efforts ever. It has resulted in a patchwork of 22 states across the country where the 2015 “Clean Water Rule” is in effect, while the rest of the states are still using pre-2015 regulations and guidance of what constitutes a WOTUS. This is because the chief plaintiffs in the lawsuits against EPA were the other 28 states. These states consider waters within their boundaries as mostly state waters to be managed by them. A federal court set aside implementation of the regulations in the states that sued until litigation was complete. Below is a map taken from EPA’s website that shows where the two different regulations are in effect.
The revised 2018 Rule tries to simplify the definition of a “WOTUS” by making it a legal definition instead of a definition based on science.  Hence my warning above saying there is no science in this post. The preamble to the 2018 Rule says it best and I quote: “The line between Federal and State waters is a legal distinction, not a scientific one, that reflects the overall framework and construct of the Clean Water Act.”    

In brief EPA has defined “WOTUS” to be: “traditional navigable waters, including the territorial seas; tributaries that contribute perennial or intermittent flow to such waters; certain ditches; certain lakes and ponds; impoundments of otherwise jurisdictional waters; and wetlands adjacent to other jurisdictional waters.”

The new revised Rule does not include ephemeral tributaries which flow only as a result of precipitation. This is a major change from the 2015 Rule. The 2015 Rule considers all tributaries, including ephemeral ones, as WOTUS if they contribute flow directly or through another water body to a WOTUS and have the physical indicators of a bed and banks and an ordinary high water mark. I consider this the make work for hydrologists provision of the 2015 Rule. Each decision would have to be made by a hydrologist. In the case of ephemeral streams, it could result in an argument between any two reasonable hydrologists as to the above mentioned physical indicators. It could all end up back in court again.

In fact much of the 2015 Rule relies on case specific analysis of a particular water to determine if there is a clear connection to another water which is a “WOTUS.” The writers of the 2018 Rule have taken the stance that anyone should be able to identify what a “WOTUS” is from the regulation. The 2015 Rule was 9 pages. The 2018 Rule is 60 pages. I suppose this is in hopes that a farmer or developer can take all those extra pages with them and stand next to their ditch or wetland and see if it fits within the definition. I joke of course. Most of the extra pages are just references to sections of various laws which need to be amended with the new definitions. The Rule does little to help your average non-scientist or non-lawyer to clearly differentiate between what is covered and what isn’t.

There are some definitions which could help the average Joe in determining if they have a WOTUS. For example, ditches constructed in uplands are not regulated under the 2018 scheme. This is a major victory for the farmers as they are the ones who probably have the most ditches on their property and who were some of the people most upset by the 2015 “Clean Water Rule”. Upland is defined as any land area above the high water mark or high tide line that doesn’t satisfy wetland criteria of having wetland hydrology, hydrophytic vegetation (plants that live in submerged conditions), and hydric soil (saturated soil) under normal conditions. Unless it’s a ditch like the Erie Canal that you can navigate, a ditch altering a tributary or built in an adjacent wetland to a WOTUS then you can be pretty confident that you are not going to have to get a federal permit under this new Rule.

There’s also a fairly sharp line drawn for what lakes and ponds qualify as a WOTUS. A lake and pond has to have a clear surface water connection to a WOTUS or be flooded by a WOTUS during a typical year for them to be considered as regulated under the CWA.  Isolated ponds even though they might have some hydrologic connection via groundwater to a WOTUS are excluded.   

What is surprising and to me not clear at all is the application of the 2018 Rule to wetlands. The only wetlands to be considered WOTUS are those that are adjacent to waters regulated under the new 2018 Rule. Adjacent means the wetland must abut a WOTUS. Abut in the regulations is defined as where a wetland actually touches a WOTUS at either a point or a side. The wetland also must have a direct surface connection to the WOTUS. No subsurface groundwater connections allowed. Any wetland that is physically separated from a WOTUS by upland, or by dikes, barriers or similar structures is not regulated. The preamble says that this will end the need to make case specific evaluations of wetlands to determine if they have a hydrologic connection to a WOTUS.

I doubt it. This is going to be far more difficult than the writers of this Rule imagine. Property owners will neither be able to make the determination themselves that there is a direct surface connection which occurs either from a wetland being inundated by a regulated water such as a tributary, lake, pond/impoundment, or ditch, nor in many cases are they going to be able figure out if there is surface flow from the wetland to the regulated water. No that is going to take a professional determination.

There are a number of other exclusions to the application of the Rule specified in the text including groundwater, prior converted cropland, artificially irrigated areas for rice and the like, stock ponds, settling basins, log cleaning ponds, water filled depressions as part of a mining or construction, gravel and fill pits, storm water ponds and waste water treatment systems. I suspect once the Federal Notice comes out there will be quite a few comments made to the public record and we will see another rewrite, but it is unlikely in my opinion that we will see anything that can satisfy the EPA Administrator’s desire for a set of regulations whereby the average person will be able to make a determination of whether a water body is a WOTUS. Trying to regulate natural hydrologic systems is about as clear as the mud in a wetland.        
Revised Rule on the Definition of “Waters of the United States”

On December 11, 2018 the Acting U.S. Environmental Protection Agency (EPA) Administrator Andrew Wheeler held a live video announcement about the upcoming release of the revised regulatory rule on the definition of the “Waters of the United States” – also referred to by some as the Clean Water Rule. According to Wheeler, the rule will be advertised in the Federal Register within the next four weeks but will also be posted in advance on the EPA website. Once the Rule is advertised in the Federal Register, there will be a 60 day public comment period. Wheeler stated during the question and answer session of the video announcement: “the rule will allow you to stand on your own property and tell whether it is a water body under Federal jurisdiction.”  

Biogeochemistry of Nutrient Pollution

Yuck!

I have used the term biogeochemistry in several blog posts on nutrient pollution and have been asked to explain what this term means and what role biogeochemistry plays in nutrient pollution. Biogeochemistry is a mouth full, but if you dissect the word then you see that there are two prefixes attached to the noun chemistry – bio and geo. Bio is short for biology and geo for geology. Biochemistry refers to the chemical processes taking place within living things, for example the incorporation of nitrogen into a plant’s proteins and chlorophyll. Geochemistry on the other hand is the study of the chemistry of geological processes, such as, the behavior of nitrogen in water and soils. So biogeochemistry is the combination of the two.


To explain further, let’s follow through with the example of the biogeochemistry of nitrogen pollution. Did you know earth’s atmosphere is 78 % nitrogen? That’s good right? After all, living organisms on earth need nitrogen for use in daily metabolic functions. But plants including algae can’t directly use the nitrogen in the air. It’s kind of like that old maxim about the ocean – “water, water everywhere but not a drop to drink.” Nitrogen gas has to be converted into ammonia or nitrate in order for plants to be able to use it. Nitrogen fixation and nitrification are the primary processes of conversion.


Nitrogen fixation produces ammonia. The chief nitrogen fixers on the planet used to be bacteria. But of course now humans have gotten into the game. Nitrogen fixation occurs as a result of fossil fuels being burned in power plants and during combustion in car engines. The process called nitrification converts ammonia to nitrite and then on to nitrate. Nitrification is pretty much just carried out by single cell organisms like bacteria. Both nitrogen fixation and nitrification require oxygen.


These biogeochemical processes occur both in soils and in water. So in water bodies like lakes, rivers, estuaries and oceans, bacteria are busy converting unusable nitrogen into usable forms, which algae – just like terrestrial plants – can use to grow. There’s also another process called denitrification which is going on in soils and water that are oxygen deficient. A group of bacteria which prefer oxygenless environments are busy taking nitrate and converting it back to unusable nitrogen gas. The nitrogen gas formed by denitrification is then cycled back into soils and water where it is once again used in the nitrogen fixation and nitrification process. It’s just one perpetual do-loop and is called the “nitrogen cycle” by scientists.


Of course the algae require other nutrients like phosphorous to grow and they depend on sunlight for photosynthesis, but in coastal waters and estuaries, the growth of algae is only limited by the availability of nitrogen. This is because these little algae guys need 16 times more nitrogen than phosphorous to grow and ocean waters are low in biologically usable nitrogen compared to phosphorous. It’s the exact opposite for freshwater lakes and streams.  In general if you add a bunch of man-made forms of nitrogen from fossil fuel combustion, nitrogen fertilizers, farm animal manure, and human waste (from wastewater treatment plants) to estuarine and coastal waters then algae are going to thrive.


However there are all sorts of other biogeochemical interactions that can come into play which affect the availability of nitrogen compounds to algae in the water. Take phosphorous, it readily adsorbs onto sediments under normal oxygen conditions and is then not available to the algae floating around in the water. In this case, adding nitrogen to the water won’t result in excessive algae growth. However if a water body is lacking in oxygen then sediments will release adsorbed phosphorous back into the water. This is because adsorption of phosphorous in sediments is strongly dependent on the presence of iron – oxidized iron. Iron forms sulfide compounds in water bodies without oxygen. Phosphorous does not interact in the same way with iron sulfides in sediments as it does with iron oxides. Therefore in low oxygen zones, phosphorous is more available in the water to help algae prosper when there are sources of nitrogen pollution.


Iron is also needed by algae for photosynthesis. Iron is not very soluble in water so it has to combine with organic matter to be available to aquatic organisms. The amount of organic matter in low oxygen waters is higher than it is in water with normal oxygen levels, because well, a lot of things are dying down there in the no oxygen zone since most aquatic organisms need oxygen to survive. Increased iron is then available in the water to help algae grow.


Complicated right? And I haven’t even touched on the issue of silica and how it impacts the type of algae growing in a water body. The diversity of biogeochemical interactions within a water body is the reason why each one must be studied independently to determine how best to prevent nutrient pollution.

Georgia Coastal Pollution

The world lies east: how ample, the marsh and the sea and the sky!

A league and a league of marsh-grass, waist-high, broad in the blade,

Green, and all of a height, and unflecked with a light or a shade,

Stretch leisurely off, in a pleasant plain,

To the terminal blue of the main.

Oh, what is abroad in the marsh and the terminal sea?

Somehow my soul seems suddenly free

From the weighing of fate and the sad discussion of sin,

By the length and the breadth and the sweep of the marshes of Glynn.

– Sidney Lanier

Marshland in Georgia


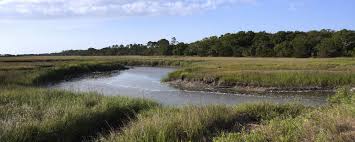
Georgia has the largest extant marshland along the entire Atlantic coast. Except for the intrusion of Interstate 95 and the growth of the cities of Savannah and Brunswick, the landscape has changed little since Sidney Lanier wrote his poem about the Marshes of Glynn in Georgia during the 1800’s. The reason for the wetland preservation is the forward thinking people of the state of Georgia who back in 1970 supported and passed a law protecting the coastal marshes of Georgia (Georgia Coastal Marshlands Protection Act.) Georgia has around 370,000 acres of estuarine tidal marsh bordering its 100 mile coastline. The state has also protected most of the barrier islands along the coast and they are primarily state and federal parkland. With such little development one might expect nearly pristine water quality off the coast of Georgia. One would be wrong.

Five major rivers flow through the coastal region of Georgia and empty into the Atlantic Ocean – the Savannah, the Ogeechee, the Altamaha, the Satilla, and the St. Mary’s Rivers.  The Satilla and St. Mary’s River are blackwater rivers. Blackwater rivers are named for the color of their water which is a dark tea brown to black. The color results from the decay of the abundant vegetation in the marshes through which the rivers flow. The water in blackwater rivers is usually more acidic than rivers with clear water and it may also have lower dissolved oxygen because of the vegetative decay. The watersheds of all five rivers are large and encompass not only the salt and freshwater marshes along the coast but the upstream woodlands, agricultural lands, and small cities and towns which dot the region. Forests and wetlands are the primary land cover in these watersheds. Farms only make up 8 percent of the land use. The widely dispersed population centers cover 7 percent of the land.

In spite of the near perfect ecological conditions along Georgia’s coast, each of the rivers has impaired water quality. Impaired water quality means that the water in a certain stretch of the river does not meet the pollution standards for the water’s designated use, like fishing or swimming. The Georgia Environmental Protection Division issued a Surface Water Quality Resource Assessment in 2017 which identified 413 miles of impaired waters in the 5 coastal watersheds and impairment of two inlets where the rivers meet the ocean. The major cause of impairment is low dissolved oxygen, which is problematic for aquatic organisms like fish since they (like us) need oxygen to survive. The second cause of impairment is fecal coliform. Fecal coliform is a bacteria produced in the intestines of humans, other mammals, and birds and is discharged with their poo.

If you were a water scientist, you would immediately suspect – based on the fecal coliform levels in the surface water of the rivers – there might be a gigantic wastewater treatment problem in the towns and cities within the watershed. But no, the Coastal Georgia Regional Water Plan issued in June 2017 identified Bryan County wastewater treatment plants as the only ones in the entire area needing upgrades to meet water quality. The main contributors to water pollution, according to both The Surface Water Quality Resource Assessment and the Coastal Georgia Regional Water Plan, are non point sources like urban development in the small towns and cities within the watersheds, agriculture which consists primarily of livestock operations in the upland areas, and silviculture (a fancy name for tree farm operations). Widespread use of septic systems in this rural environment is also probably a major contributor to surface water degradation.

Blame for some of the dissolved oxygen problems also can be laid on the nutrients – nitrogen and phosphorous, but the lack of widespread dead zones such as the ones in the Gulf of Mexico caused by fertilizer runoff into the Mississippi River and the ones in the Chesapeake Bay caused by fertilizer run-off and overdevelopment in the watershed don’t exist off the coast of Georgia. Nutrients cause algae blooms. The algae die and their decay depletes the water of oxygen. The lack of widespread nutrient related dead zones off the coast of Georgia can be attributed to the lack of development and limited agricultural operations, but also to the existence of abundant marshlands. All wetlands remove nutrients from water. This has been documented in a number of scientific studies over the last thirty years. The soils in wetlands are called hydric soils because they are saturated. These types of soils are full of organic matter from all the decaying wetland vegetation. Denitrifying microbes love these soils and provide a substantial removal system which locks up the nitrogen and keeps it from flowing out of the wetland. The marsh plants also like the excess nutrients because it helps them to grow, so they suck up as much of it as they can get. Waters leaving a marsh are substantially cleaner than those which entered, so much so, that environmental scientists often construct artificial wetlands just to treat nutrients. Georgia’s preservation of their coastal wetlands has helped save them from the nightmare conditions which other aquatic environments are undergoing.

The Coastal Georgia Regional Water Plan is part of another forward thinking effort by the Georgia state government to engage in state wide water planning efforts to sustainably manage water resources throughout the state. State wide water planning began in 2009 and the first coastal plan was issued in 2011. The 2017 plan is an update. The goal of water planning on the Georgia Coast is to meet water demands while protecting ecosystems dependent on clean water such as Georgia’s significant offshore commercial and recreational fisheries.

The Coastal Regional Water Plan recognizes the sources of contamination and the impairments identified in the 2017 Surface Water Assessment and has established specific actions to be taken to reduce pollution including replacing and upgrading the wastewater treatment plants in Bryan County or moving their discharge locations. Also identified in the plan is a monitoring program to determine the sources of the persistent fecal coliform contamination, establishment of best management practices for stormwater runoff such as retention ponds and erosion controls, providing silviculture operations with incentives for restoring wetlands, and supporting implementation of agricultural runoff controls such as manure management, conservation tillage, and planting of cover crops.

Most actions under the plan are anticipated to be implemented by the year 2025. Little future development is anticipated along the coast because of the protections the state of Georgia has provided for their marshlands. These protections will limit the surface water degradation which is found in other states like Louisiana ( https://waterblogger.org/water-quality/gulf-of-mexico-pollution/) and Maryland (https://waterblogger.org/water-quality/chesapeake-bay-pollution/ ) where wetlands have been destroyed and as a consequence there has been serious water degradation from nutrient pollution.

This is the fourth blog post in a series concerning nutrient pollution.

Gulf of Mexico Pollution

Can you imagine an area of pollution in the ocean which is the size of the state of New Jersey and where no marine life can live because there is too little oxygen in the water? You would think if such a place existed then it would be featured on the nightly television news and be in the newspapers on a regular basis. After all journalists flocked to the Gulf of Mexico when the oil spill from the Deep Water Horizon occurred in 2011 and it was reported in the media on a daily basis. But indeed such a large polluted area in the ocean does exist and it is located off the coast of Louisiana in the Gulf of Mexico. Perhaps journalists ignore its’ existence because there aren’t dramatic photos to show on the television like flowing oil from a borehole on the ocean floor or multiple oiled seabirds. In fact if you sailed right through this huge polluted zone on a boat, you would not even notice it, unless of course you tried to catch a fish.


The lack of oxygen in this area of the Gulf of Mexico is caused by “nutrient” pollution. Essentially water flowing down the Mississippi River is full of sediment, phosphorous, and nitrogen washed off the abundant farmlands in the central part of the United States. Phosphorous and nitrogen are called nutrients because they are used by living things for growth and metabolic functions. When all those nutrients in the freshwater river flow into the salty waters of the Gulf of Mexico, two things happen. Number one, the freshwater forms a lighter layer on top of the heavier salty water in the near shore environment of the Gulf. Number two, all those nutrients in the freshwater feed the algae living at the Gulf’s surface where the sunlight is abundant. This causes the growth of massive algal blooms. When the algae eventually die, they drop to the salty bottom layer of water. The decay of the algae uses up the oxygen in the bottom salty layer of water and produces a hypoxic or dead zone. (For more information on nutrient pollution follow this link https://waterblogger.org/water-quality/nutrient-pollution/ ).


Scientists have been measuring the extent of the dead zone in the Gulf of Mexico for over thirty years. The size of the dead zone has gotten larger and larger and in 2017 it grew to be the largest size ever – 8776 square miles. You are probably thinking, why isn’t someone doing something about this huge dead zone in the Gulf of Mexico, like the U.S. Environmental Protection Agency (EPA), isn’t that their job? Yes it is, and the agency does have the regulatory tools under the Clean Water Act to require waters of the United States to meet Water Quality Standards. But so far, and despite recommendations to EPA in 2007 by the National Academy of Science for the agency to use their regulatory tools, the EPA instead has decided to improve water quality in the Gulf through the use of a voluntary watershed effort among the states with drainages entering the Mississippi River. A Hypoxia Task Force was established in 1997 which includes several federal agencies and the states of Iowa, Illinois, Minnesota, Wisconsin, Kentucky, Tennessee, Arkansas, Ohio, Missouri, Mississippi and Louisiana. This may seem like a lot of states, but in reality, it is not even all the states which have drainage into the Mississippi River, after all the entire Mississippi River basin covers 1,245,000 square miles – 41 percent of the lower 48 states of the United States. However, the states involved in the Task Force are the biggest contributors of nutrients to the river.


The Hypoxia Task Force regularly reports on progress being made to reduce nutrient pollution. The Task Force set itself a goal of reducing the hypoxic zone in the Gulf to less than 3100 square miles by the year 2035. In order to reduce the hypoxic zone to this size, the amount of nutrients entering the Gulf of Mexico must be reduced by 45 % from the average amount of nutrients measured between1980 and1996.  An interim reduction goal of 20 % has been set for the year 2025, just seven years from now. The Task Force is relying on individual state strategies to achieve these nutrient reductions. At this point all states involved with the Hypoxia Task Force have drafted or completed strategies. Each state has set very different methodologies and plans for achieving nutrient reduction goals. Other than some targeted improvements to reduce nutrients from wastewater treatment plants, most of the actions in the state strategies are voluntary.


The Hypoxia Task Force knows where most of the nutrient pollution is coming from, after all this problem has been studied for a long time. The U.S. Geological Survey (USGS) has been able with the help of the Natural Resource Conversation Service (NRCS) to define where the greatest amount of nutrient pollution is coming from in the Mississippi River Basin. Below is a map showing the main sources of nutrient pollution to the Gulf. The map was put together by the USGS for the EPA’s 2017 Biennial Report to Congress.

Nutrient Sources to the Mississippi River from the EPA 2017 Report to Congress

As you can see from the map, the states with the greatest nutrient contributions to the Gulf are in the northern basin of the Mississippi River. So states like Minnesota, Iowa, Illinois, Wisconsin and Indiana, which are all over a thousand miles from the Gulf of Mexico, are the biggest polluters. Most of the pollution is coming from agricultural lands. Some of the causes are over fertilization of crops, uncontrolled manure at farm animal operations, and even the growing of certain types of crops, such as soybeans, which can produce excess nitrate in the soil. According to EPA, there are numerous conservation methods identified by the Department of Agriculture which can vastly reduce these sources of pollution. Studies conducted by the NRCS on conservation practices already being implemented in the upper Mississippi River Basin show reductions of nutrients can be achieved in the order of 5 to 34 % for nitrogen and 1 – 10 % for phosphorous. The NRCS studies attribute these conservation practices within the whole Mississippi River Basin to an 18 % reduction in nitrogen and a 20 % reduction of phosphorus in the surface water entering the Gulf of Mexico.


With such large nutrient pollution reductions from existing conservation practices, one wonders exactly why the hypoxic zone in the Gulf is getting larger. There are a couple of reasons. Poor nutrient controls have been in place for multiple years. A lot of the old nutrients which washed off farmland years ago are now contained within the sediment of the streams and rivers forming the Mississippi River watershed. This sediment in the stream and river channels is a continuing source of nutrient pollution into the Gulf. Every time there’s a big storm or there’s lots of precipitation then sediments containing nutrients are scoured from the river and stream channels and washed further down the river toward the Gulf. Even if you were to eliminate all the nutrients in farm runoff from now into the future, there are still these legacy nutrients over which one has to worry.


I’m afraid we always tend to blame the farmers for all our nutrient pollution problems. Farmers are probably unfairly targeted to shoulder most of the nutrient reductions when many of the causes of the long term pollution problem in the Gulf are really a result of the over engineering and channelization of the Mississippi River to provide transportation and to reduce flooding. These activities have resulted in loss of streamside vegetation, including forests and wetlands that would have helped buffer the nutrient pollution. (Here’s a link to more reading on the problems of the Mississippi River https://waterblogger.org/water-quantity/dams-and-their-impacts-on-wetlands/  .) Scientists also blamed the increased size of the dead zone on the larger and more dispersed freshwater flow resulting from the channelization and diversion of the river into the Gulf through the lower portion of the Mississippi Delta because it has spread the nutrients and the stratification in the coastal waters over a much larger area then would have otherwise occurred.


So whatever pollution reduction methods are implemented by the states through their strategies, it is unlikely to produce immediate reductions in the size of the dead zone in the Gulf even by 2035. Unless of course other options like stream and river restoration activities are also incorporated into the Hypoxia Task Force’s plans.

Chesapeake Bay Pollution

The Chesapeake Bay is a large estuary on the Atlantic coast of the United States covering about 7000 square miles and splitting both the states of Maryland and Virginia in two. Estuaries are common in coastal areas where streams or rivers enter the ocean. The Chesapeake Bay is an unusually long estuary, stretching 206 miles from the border of Pennsylvania and Maryland to its confluence with the ocean near Norfolk, Virginia. The Susquehanna River which starts in New York State and flows through Pennsylvania is the Chesapeake Bay’s main tributary. In fact the Chesapeake Bay is actually the ancient valley of the Susquehanna River which after the last glacial epoch was flooded as the glaciers melted and sea level rose. A “drowned river valley” is what geomorphologist’s call landforms like the Chesapeake Bay. Other major tributaries to the Chesapeake Bay are the Patuxent, Rappahannock, Potomac, and James Rivers.


Similar to other coastal estuaries, the Chesapeake Bay is affected by the oceans tides and is therefore a mixture of salt and fresh water, with the freshwater coming from the upland tributaries and the saline water from the ocean. The closer you get to the mouth of the Bay near Norfolk, the saltier the water gets. However, the connection between the Chesapeake Bay and the ocean is a narrow and confined one, which makes the tides in the Bay more like the Lazy River ride at the water park rather than the aggressive water slide estuaries of the San Francisco Bay or Puget Sound. Tides range from 1 to 3 feet on the Chesapeake Bay while the San Francisco Bay can range up to nearly 6 feet and the Puget Sound as much as 8 feet.


The Chesapeake Bay’s pollution problems started the day that the first European settlers stepped off the boat on Clement Island Maryland in 1634 and started clearing land, planting crops, and raising animals. The big three pollutants in the Chesapeake Bay are phosphorous, nitrogen, and sediment. Phosphorous and nitrogen are nutrients and their main sources in the Bay watershed are agricultural crops, manure from livestock operations, urban storm water, wastewater treatment plants, and atmospheric deposition from the burning of fossil fuels in power plants and motorized vehicles. Sediment of course as everyone knows comes from erosion and the chief causes of erosion in the Chesapeake Bay watershed are – agricultural practices and urban development. The fact that the Chesapeake Bay is essentially a bathtub and sediment along with nutrients settle out at the bottom, instead of flushing out to the ocean like the pollutants do in other estuaries, is one of the chief causes of the continuing eutrophication of large parts of the Bay (to learn more about nutrients and eutrophication read my post on the subject at this link  https://waterblogger.org/water-quality/nutrient-pollution/)


Eutrophication is pretty much the result of the huge algal blooms caused by excess nutrients in the Bay waters. The death and decay of algae uses up dissolved oxygen in the water. Since aquatic organisms like fish, crabs, clams, worms and so forth need oxygen to breath, they pretty much avoid these “dead zones” of oxygen less water in the Bay. The nutrients at the bottom of the Bay and the regular flushing of nutrients from soil and paved surfaces into the Bay during rain events serve as a continuing source of nutrients for the algae.


The people who live in the Chesapeake Bay area have been trying to “Save the Bay” since 1983 when the Chesapeake Bay Program was established. The states of Maryland, Pennsylvania, Virginia and the District of Columbia were the first participants. To spread the joy, other jurisdictions in the Chesapeake Bay’s enormous watershed, covering over 64,000 square mile, were signed up in 2001 to help reduce the big three pollutants. The jurisdictions include Delaware, New York, and West Virginia.


You would think with all these States getting together and all the money being spent ($73 million in 2017 alone) that the Bay would be “Saved” by now. But no, there has been very little actual will to “Save the Bay”, although everyone does a lot of talking about it.  The U.S. Environmental Protection Agency (EPA) finally got fed up with the States after 25 years of restoration efforts and pollution reduction schemes resulted in no substantial improvement in the water quality in the Chesapeake Bay. The EPA decided to work with the 7 government jurisdictions to establish a Total Maximum Daily Load (TMDL) for the Chesapeake Bay. The TMDL was issued at the end of 2010. I have talked about TMDLs in this blog before, but briefly for new readers: TMDLs are set for waters of the United States that are considered “impaired”. State governments are required under the Clean Water Act to report impaired waters in their jurisdiction and establish TMDLs that will restore the water for its designated use, such as swimming, fishing, or drinking.


The TMDL limits the amount of nitrogen, phosphorous and sediment each state can contribute to the Chesapeake Bay. Below are the actual allocation numbers designated in millions of pounds per year per state.


Jurisdiction Nitrogen Phosphorous Sediment
       
Pennsylvania 73.93 2.93 1,983.78
Maryland 39.09 2.72 1,218.10
Virginia 53.42 5.36 2,578.90
District of Columbia 2.32 0.12 11.16
New York 8.77 0.57 292.96
Delaware 2.95 0.26 57.82
West Virginia 5.45 0.59 310.88
TOTAL 185. 93 12.54 6,453.61

Source: Chesapeake Bay Total Maximum Daily Load, U.S Environmental Protection Agency, December 29, 2010


These limits reduce the total current contribution of the big three pollutants by 25% for nitrogen, 24% for phosphorous and 20% for sediment.  The total is the maximum amount of the three pollutants that the Bay can receive and still meet Water Quality Standards for dissolved oxygen, water clarity, submerged vegetation, and chlorophyll a (chlorophyll a is a measurement means of determining how much algae is in the water).


In order to meet these goals each State had to submit to EPA a Watershed Implementation Plan showing what projects would be undertaken to meet their limits. As part of each state plan there are short and long term milestones that must be met. The goal is to meet Water Quality Standards in the Bay by 2025. Well that’s not exactly correct. In reality and according to the scientist’s models, the Chesapeake Bay will only theoretically meet Water Quality Standards by 2025. The scientists studying and working to “Save the Bay” often refer to a “lag time” for achieving Water Quality Standards which is a result of the legacy pollutants built up in the Bay and all of its tributaries, and which will continue to contribute to poor water quality even after the limits for the big 3 pollutants are met in 2025.


By setting the TMDL, the EPA essentially drives the Chesapeake Bay Program now. There are short term milestones to be achieved every 2 years in order to show incremental progress in restoring the Bay. These short-term milestones are primarily agricultural management improvements to reduce pollution, because it is the easiest way of achieving progress. There is a good bit of money available through the Department of Agriculture to assist farmers in conservation efforts. These agricultural management strategies target alternative and cover crops, tillage practices, manure waste management, water control structures, pasture management, etc. Other easy short term targets are restoration of wetlands, planting of stream side (riparian) vegetation like trees, and reductions in the atmospheric deposition of nitrogen since nitrogen is regulated under the Clean Air Act causing the amount of nitrogen in the atmosphere from fossil fuel combustion to slowly decrease over the years.


To see if the TMDL and the long range milestones in the Watershed Implementation Plans would restore the Bay by 2025 as envisioned, the EPA decided to ask the National Research Council (NRC) to assess whether their new plan to “Save the Bay” would achieve its goals and objectives. It was the first real outside assessment of the Bay Program other than a nasty General Accounting Office assessment in 2005. The NRC published a great big report on the subject in 2011, entitled “Achieving Nutrient and Sediment Reduction Goals in the Chesapeake Bay.”


It is an amazing report, full of interesting statistics. For example did you know that 17 million people live in the Chesapeake Bay watershed? That’s a lot of people. But those people are widely dispersed, except for urban centers like Washington, D.C. and Baltimore. Only 7 % of the land in the watershed is urban and amazingly only 22 % is agricultural land. The rest is wooded and open space. But the report brings up the worrisome nature of the continued urban growth within the watershed.


According to the NRC, there has been significant success in decreasing nutrients from municipal waste water treatment plants in urban centers. Permit requirements were put in place back in 2005 which resulted in massive upgrades to nutrient removal systems in the wastewater treatment works of cities and towns within the Chesapeake Bay watershed. The NRC cites statistics that as of 2009, 78% of wastewater treatment plants had achieved 78 % of the reduction goals for nitrogen and 99 % of the phosphorous goals set by EPA to improve water quality in the Bay. But as the NRC points out, as population in the watershed grows, there will simply be more wastewater to treat, and more effluent released into the rivers to flow down to the Bay.


The NRC report outlines major concerns with storm water reduction goals for urban areas. Storm water is the water that runs off of streets and yards into either a storm water collection system or directly into water ways. The report says the limits set for reduction of pollutants from storm water will be the most difficult to achieve because of the high costs and the low removal rates of technologies used to decrease the big 3 pollutants. The NRC questions the ability to achieve the storm water pollution reduction goals due to the rapid rate of population growth and development in the Chesapeake Bay’s watershed. What sort of technologies is the NRC referring to for storm water management? They are talking about rain gardens, use of pervious materials instead of asphalt and concrete, use of narrower streets, and sunken medians. These technologies can all be achieved through regulation for new development, but it will be hard to get existing development to implement them because of the expense. The NRC says they are costly and inefficient because they rely on their widespread use across a landscape to remove pollution from many small sources.


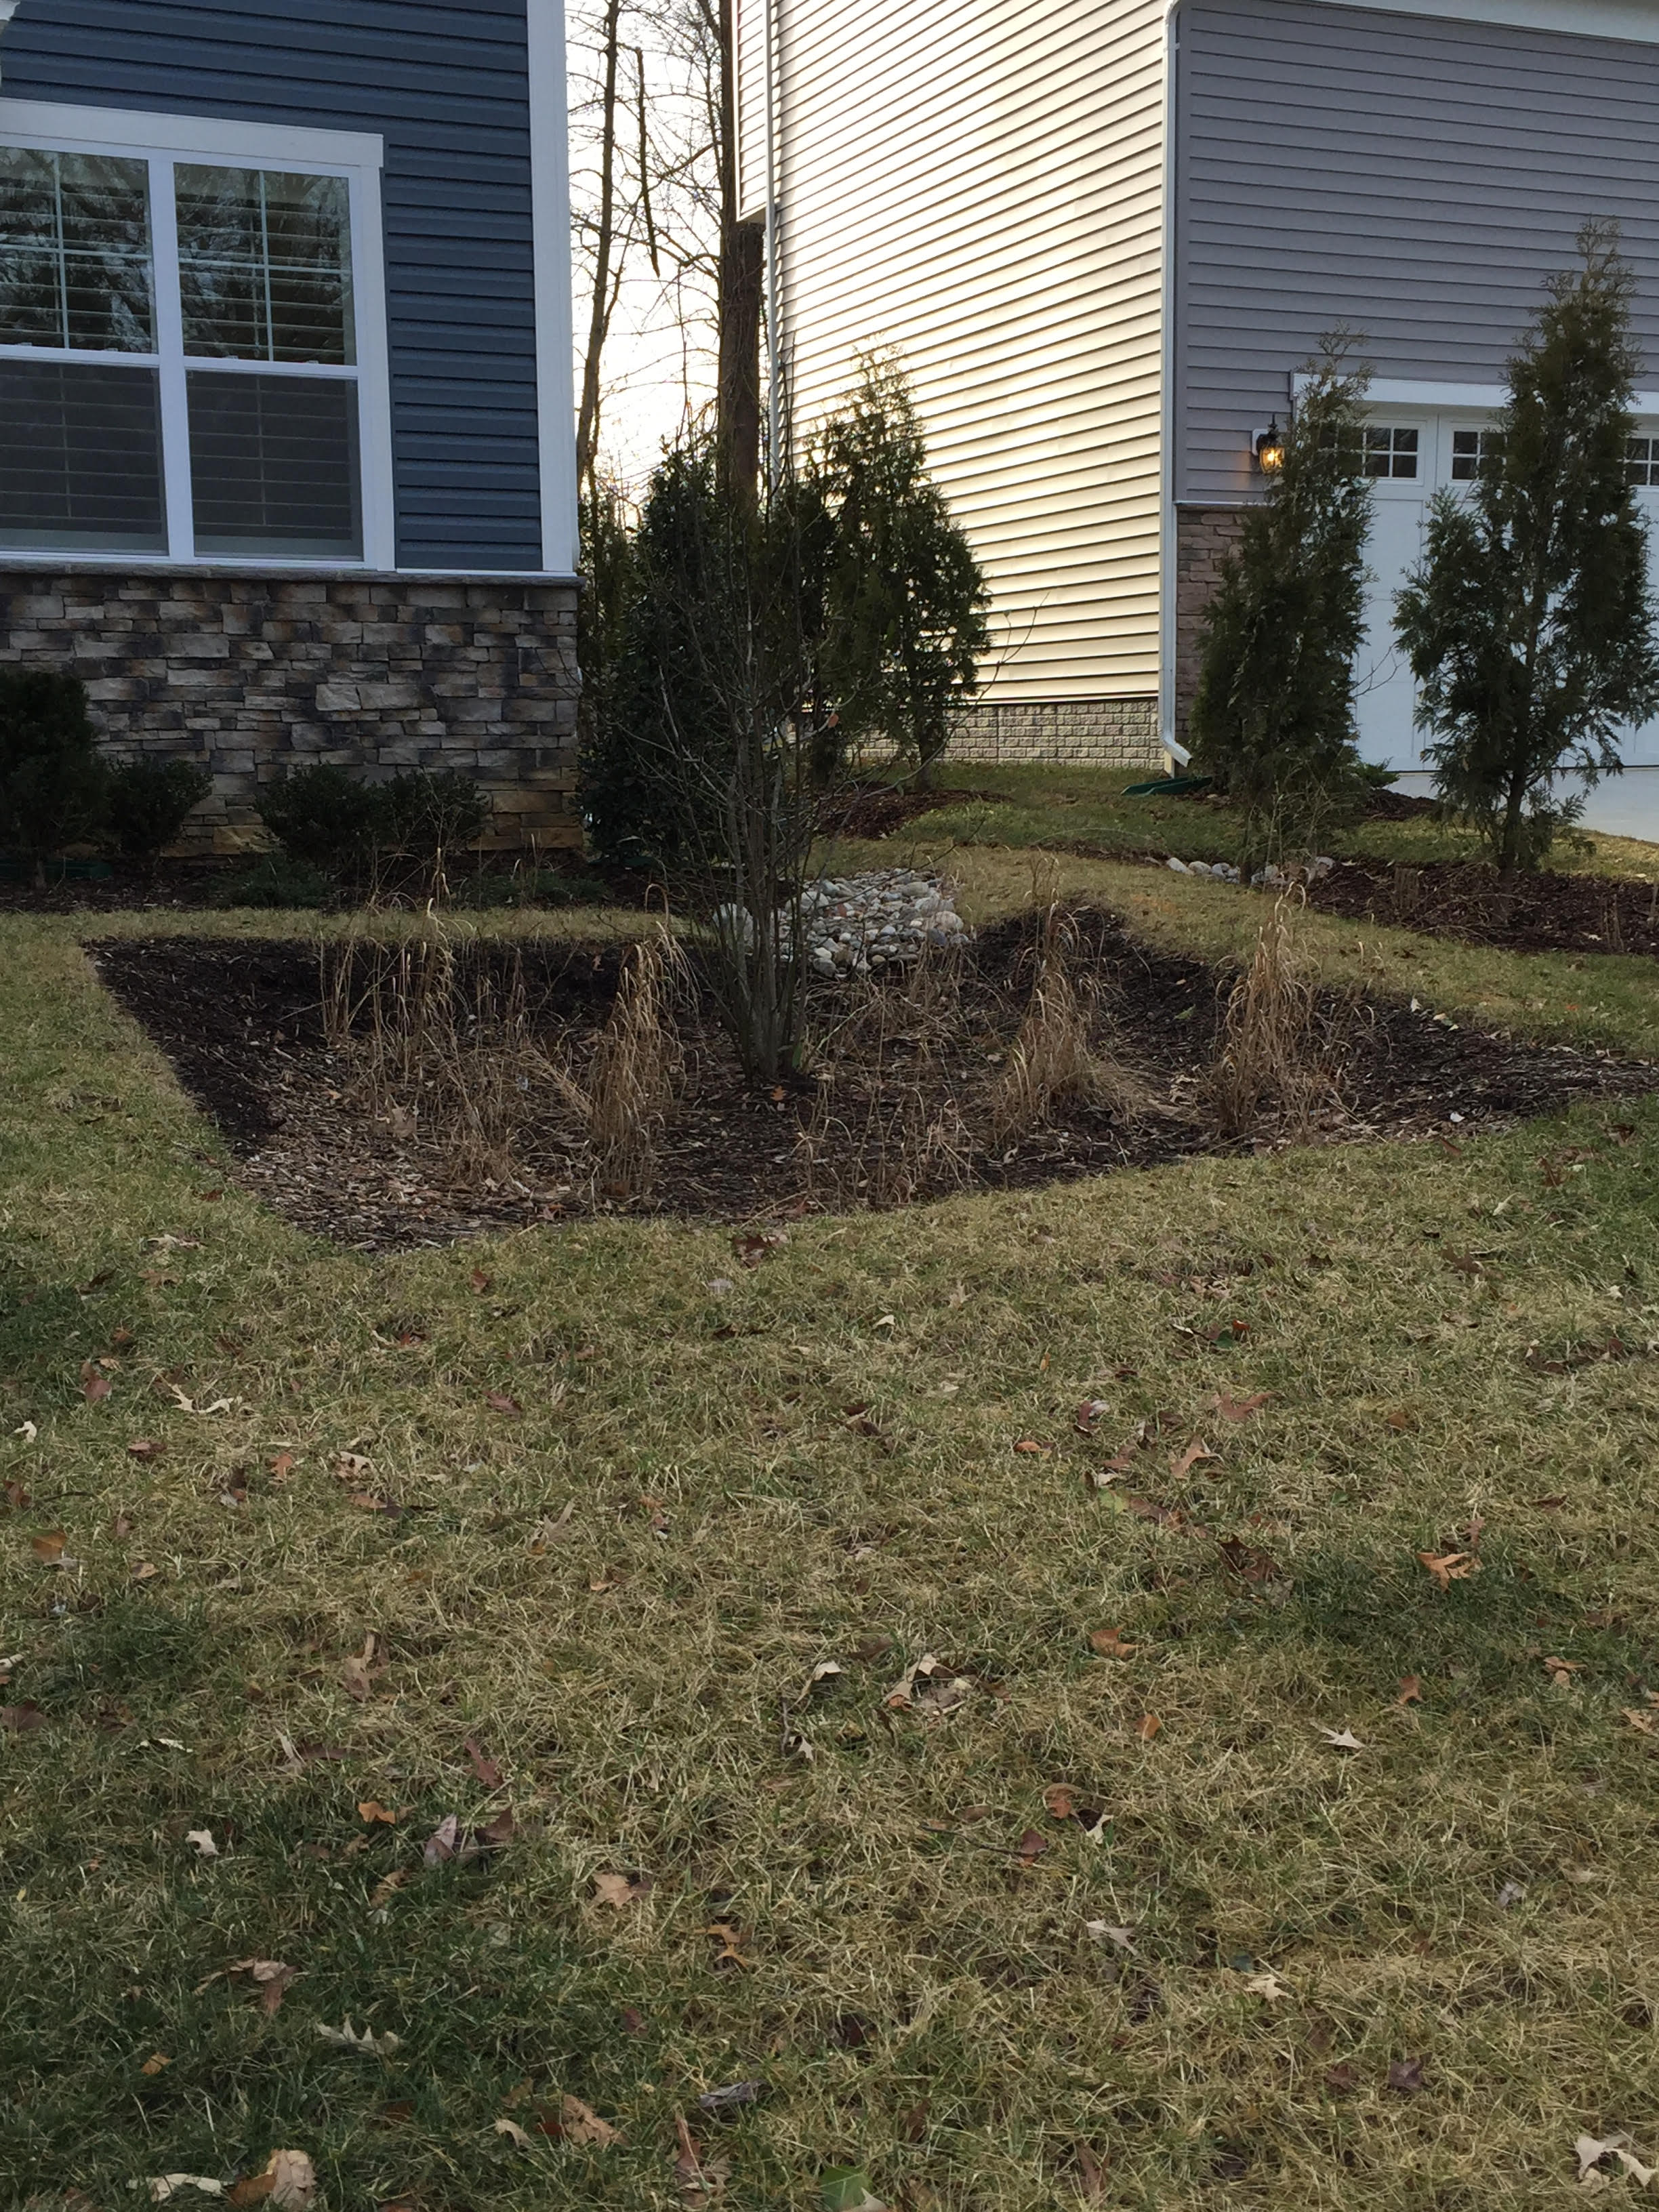
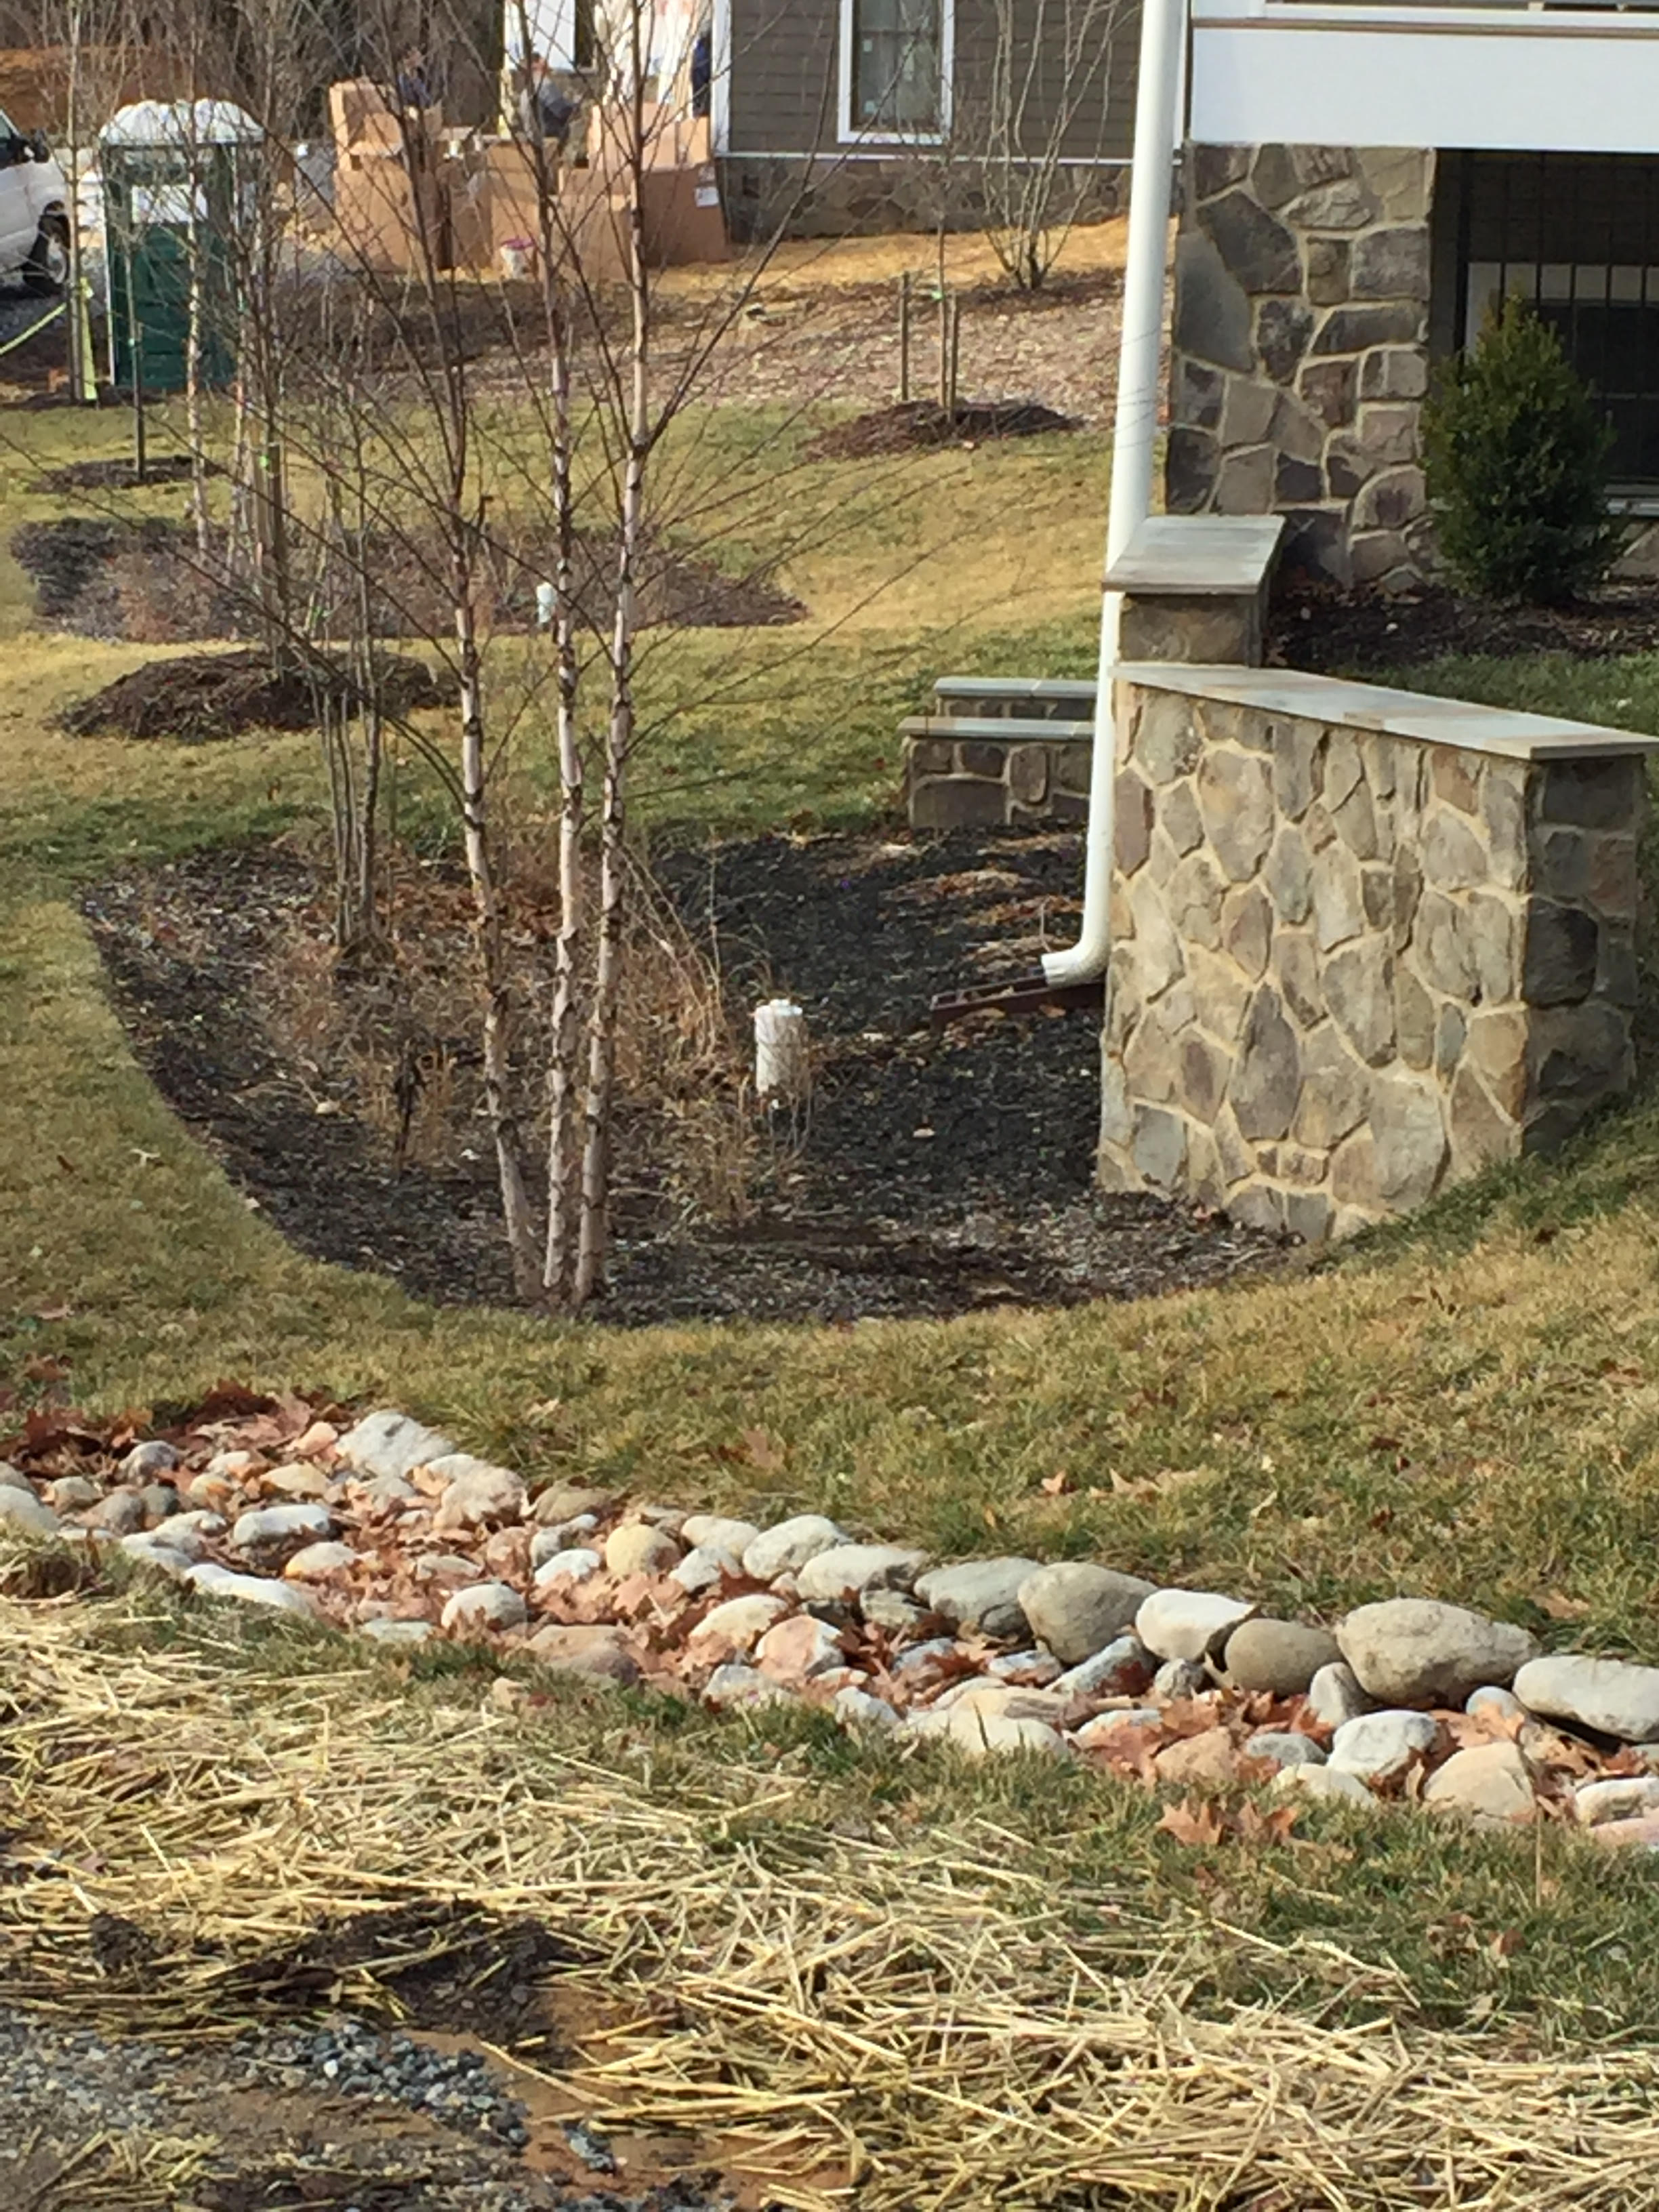
What do they look like? Here’s pictures of some rain gardens installed in new development. This is on a large piece of property where there was only one house, but zoning authorities allowed it to be torn down and 5 houses built in its place as long as they installed rain gardens.

I know you are laughing. This is supposed to “Save the Bay”? And how long do you think these are going to stay in place before the homeowners see them as a safety issue for children playing in the yard? That is the other problem with these types of features – maintaining them.


The other source of pollution that the NRC says will be difficult to reduce is the nutrient pollution from septic tanks. The NRC report states that between 1990 and 2000, the watershed population increased by 8 % but the land converted to development more than doubled. Much of this development is what you often hear referred to as “suburban sprawl” and many of the areas where it has occurred do not have access to urban wastewater treatment systems. NRC says 25 % of the housing in the Chesapeake Bay watershed is served by septic tanks which produce 33 million pounds of nitrogen every year. Most of that nitrogen ends up in the groundwater and is slowly transported through groundwater flow into surface water bodies and down to the Bay. The amount of time (sometimes decades) groundwater takes to reach the Bay is another lag time issue that scientists have pointed out in discussions about meeting Water Quality Standards by 2025. These days, very efficient nitrogen removal septic systems are available, but even if everyone installed one at their house, there is still all the legacy nitrogen in the groundwater from the old systems which is slowly flowing like a ticking time bomb toward the tributaries of the Bay. But of course not everyone is going to install super efficient septic systems because they are extremely costly. Many States plan on transitioning all these homes to centralized wastewater systems – another expensive endeavor.


The NRC says the population within the Chesapeake Bay watershed is estimated to reach 19 million people by 2030. Based on the current land development rate, the amount of developed land could increase by 60 %. Impervious surfaces cover 18 % of all lands in the watershed now and, according to the NRC, stream water quality is impaired when impervious surfaces in a watershed cover 5 to 6 % of the land.


So it has been seven years since the TMDL for the Bay was established and there are only eight more years in front of us until the Bay must meet Water Quality Standards. How do you think the restoration effort is going? Well it is easy to find out. The EPA produces a report every year titled: The Bay Barometer. The 2017 report is not available yet, so I took a look at the 2016 Bay Barometer. There’s some good news in the report. The number of acres of submerged grasses has greatly increased through restoration efforts. These underwater grasses are critical in providing food and shelter to aquatic animals. They also produce dissolved oxygen and absorb nutrient pollution. The Bay Program’s goal is to restore 185,000 acres by 2025 and already half of that has been achieved. Eighty two percent of a targeted 2500 miles of stream has been opened to migrating fish by removing dams and culverts.  Blue crabs are back in the Bay in great numbers as a result of crab harvesting restrictions. The goal was 215 million adult females by 2025 and already 90% of that number has been reached. Unfortunately that is about it on the success level. Planting trees along streams is way down; only 9 % of the wetlands targeted for restoration have been achieved; and only 50% of the land targeted for conservation has been protected.


There have been some improvements in water quality. Thirty seven percent of the Chesapeake Bay and its tidal tributaries met Water Quality Standards for dissolved oxygen, chlorophyll a, and clarity. That’s a 10 % increase over the previous reporting period, but it is far below the 100 % expected by 2025.


As for the big three pollutants, there was a 25 % reduction in nitrogen, a 44 % reduction in phosphorous, and a 59 % reduction in sediment from the previous year. Unfortunately again and according to The Bay Barometer, the reductions are due to the volume of river flow, which leads to the sad sorry fact that nitrogen, phosphorous and sediment levels are the highest during years of high rain when the rivers and streams are pouring water into the Bay and that the pollutants levels are lowest during dry years when the volumes are far less. The highest amount of nitrogen, phosphorous and sediment recorded in the last 10 years was in 2011 after Tropical Storm Lee.


The Chesapeake Bay Program is a good endeavor, even if its successes so far have not been great. At least the whole Bay is not completely lacking in dissolved oxygen. If things had continued as they were, the Bay would probably be in much worse shape than it is now. The best analogy for the Chesapeake Bay’s pollution problems might be the nursery rhyme of Humpty Dumpty who sat on a wall from where he had a great fall; then all the king’s horses and all the king’s men never could put Humpty back together again. The Humpty Dumpty Bay will continue as long as overdevelopment occurs in the Bay’s watershed. Development has broken the natural processes that once kept the Bay a healthy ecosystem. Government officials, scientists and non-governmental institutions are working hard to “Save the Bay”, but without restrictions on development, the task is like another analogy I can think of: Sisyphus pushing the ball up the hill in Hades.

Nutrient Pollution

My recent post on the Bloede Dam removal in Maryland prompted me to dwell a little bit on the nutrient pollution that continues to plague our water resources. Nutrients are the chief polluter of our river systems, lakes and coastal waters. It is such an old problem, but it just never gets resolved. When scientists talk about nutrient pollution, they are referring to phosphorous and nitrogen entering our waterways through surface run-off and groundwater discharge (referred to as “non-point sources”) and through direct discharges from wastewater treatment plants and other end of pipe sources (commonly called “point sources.”) Scientists are alarmed about the ever increasing amount of nutrients in our waters. So much so that a few years ago, the U.S. Environmental Protection Agency (EPA) commissioned a Nutrient Innovation Task Group composed of water managers and scientists from state governments, federal agencies and universities to define the problem. The Task Groups Report was issued in late 2009 and was actually entitled “An Urgent Call to Action.” It is a source of amazing statistics.


Just a refresher in case you don’t remember, but the problem with nutrients in our waterways is the resulting algal blooms. Scientists don’t call phosphorus and nitrogen nutrients for no reason. Both nitrogen and phosphorous are needed by living organisms for cell growth. This is why farmers spread it on their crops as fertilizer. It is why homeowners use it on their lawns. So when you have a lot of nutrients going into the water, it is like fertilizing the algae. Add sunshine and you get a bumper crop. Not really what anyone wants, because when the algae inevitably die off, the decay of their little dead algae corpses uses up the dissolved oxygen in the water through a process called eutrophication. Eutrophication produces “dead zones” or what scientists refer to as hypoxic zones. The quantity of floating algae (called phytoplankton) can increase so much that their mass actually blocks sunshine into deeper waters, depriving beneficial grasses and other vegetation that are to be found in the bottom of water bodies of the light they need for growth.


The Nutrient Innovation Task Group’s report states nutrient pollution along with the consequent overgrowth of algae and other nuisance aquatic plants as well as decreases in dissolved oxygen impairs 31% of assessed rivers and streams in the U.S., 30% of our lakes, and 50% of our bays and estuaries. The word “impairs” simply means that the function of the water resource is diminished. An example of an impaired water body would be an estuary which once supported a vital fishing industry but now has large “dead zones” where there is so little oxygen that fish can’t breathe and they have either died or vacated the area.


All of the excess nutrients entering our water bodies are from just a few sources, but they are large sources. Much of it comes from agricultural production. If there are no runoff controls on agricultural fields, excess fertilizer applied to crops can be washed into local streams. Manure from chicken and cows are also a big source of nitrogen and phosphorous to local waterways if not managed and controlled adequately. Urban storm water is another big source of nutrients as a result of all that lawn fertilizer we apply. Then there’s all the nitrogen and phosphorous coming out of wastewater treatment plants and septic systems. Humans in the U.S. produce about 18 million pounds of poop annually which is treated somewhat inadequately at our wastewater treatment plants. In 2009 when “An Urgent Call to Action” was published only 4% of the 16,500 wastewater treatment plants in the U.S. had limits for nitrogen in their permits and only 10% had limits for phosphorous. Then there are the 20% of homes in the U.S. which are on septic systems and are contributing nutrients to our surface waters via groundwater flow.


Oh wait a minute; I nearly forgot to mention another major source of nitrogen. It is from atmospheric deposition. When fossil fuels are burned in cars and power plants, it results in nitrogen oxides being emitted into the air. As they say, what goes up eventually comes down. And it comes down directly into our water resources or it is washed off our urban centers during storms and eventually makes its way into our waterways as well.


There are two well known, well studied water bodies where nutrients have caused major problems – the Gulf of Mexico and the Chesapeake Bay. The 2009 report cites that hypoxic zones cover 7900 square miles of the Gulf of Mexico and over 40% of the Chesapeake Bay. The report had a very interesting chart which I’m going to share here. It is the estimated sources of phosphorous and nitrogen going into these two water bodies.


Source: An Urgent Call to Action. Report of the State-EPA Nutrient Innovations Task Group. August 2009.

As you can see the source of most of the nutrients going into the Gulf of Mexico are from agricultural production, while nutrients going into the Chesapeake Bay are about equally split between agricultural production and urban sources.

Nutrient pollution is not a stagnant problem, because the population continues to grow. In the report by the EPA Nutrient Innovations Task Group, the chief cause cited for the escalation of nutrient pollution in water is the increase in the U.S. population. In addition, the report predicts the U.S. population will grow by 135 more million people by 2050, exacerbating the amount of nutrients flowing into our waters. The report written almost eight years ago now, states that current controls to reduce nutrient pollution of our water resources are totally inadequate. In response, the U.S. EPA and state environmental regulators developed a “Framework for State Nutrient Reductions” in 2011. The framework reflects a partnership effort to reduce nitrogen and phosphorous in U.S. waterways by prioritizing watersheds for reduction efforts and then setting actual goals such as strengthening permits for waste water treatment plants and other point sources, establishing strong programs to promote land stewardship practices for agricultural lands, and improving storm water management in urban areas.

As part of this effort states are being asked to establish numeric goals in priority watersheds for reduction of nutrients. When water scientists talk about the amount of nutrients entering a water body, they call it a load. So these efforts are aimed at reducing nutrient loads into water resources. EPA guidance in the past allowed for narrative or numerical criteria for establishing pollution concentrations below which a water body would be able to achieve its full designated use – such as commercial fishing or swimming. Narrative criteria have been mostly used by state water managers and have been rather useless in achieving improvements. Narrative criteria simply state what condition you want to achieve. Numerical criteria establish what nutrient loads must be imposed for both point sources and non-point sources entering a water body. As you can imagine numerical criteria are much harder to establish than a simple statement of what you’d like to achieve.


With the proposed framework and a call by EPA to provide numeric criteria as opposed to narrative criteria for attaining the water quality goals for a water body, I would expect to see some improvements over the last six years. After all as the old adage says, what gets measured gets done. So as a follow-up to this blog post, I will be examining over the next few months whether improvements have been achieved in the two largest hypoxic water systems in the U.S. – the Chesapeake Bay and the Gulf of Mexico.

Bloede Dam Removal

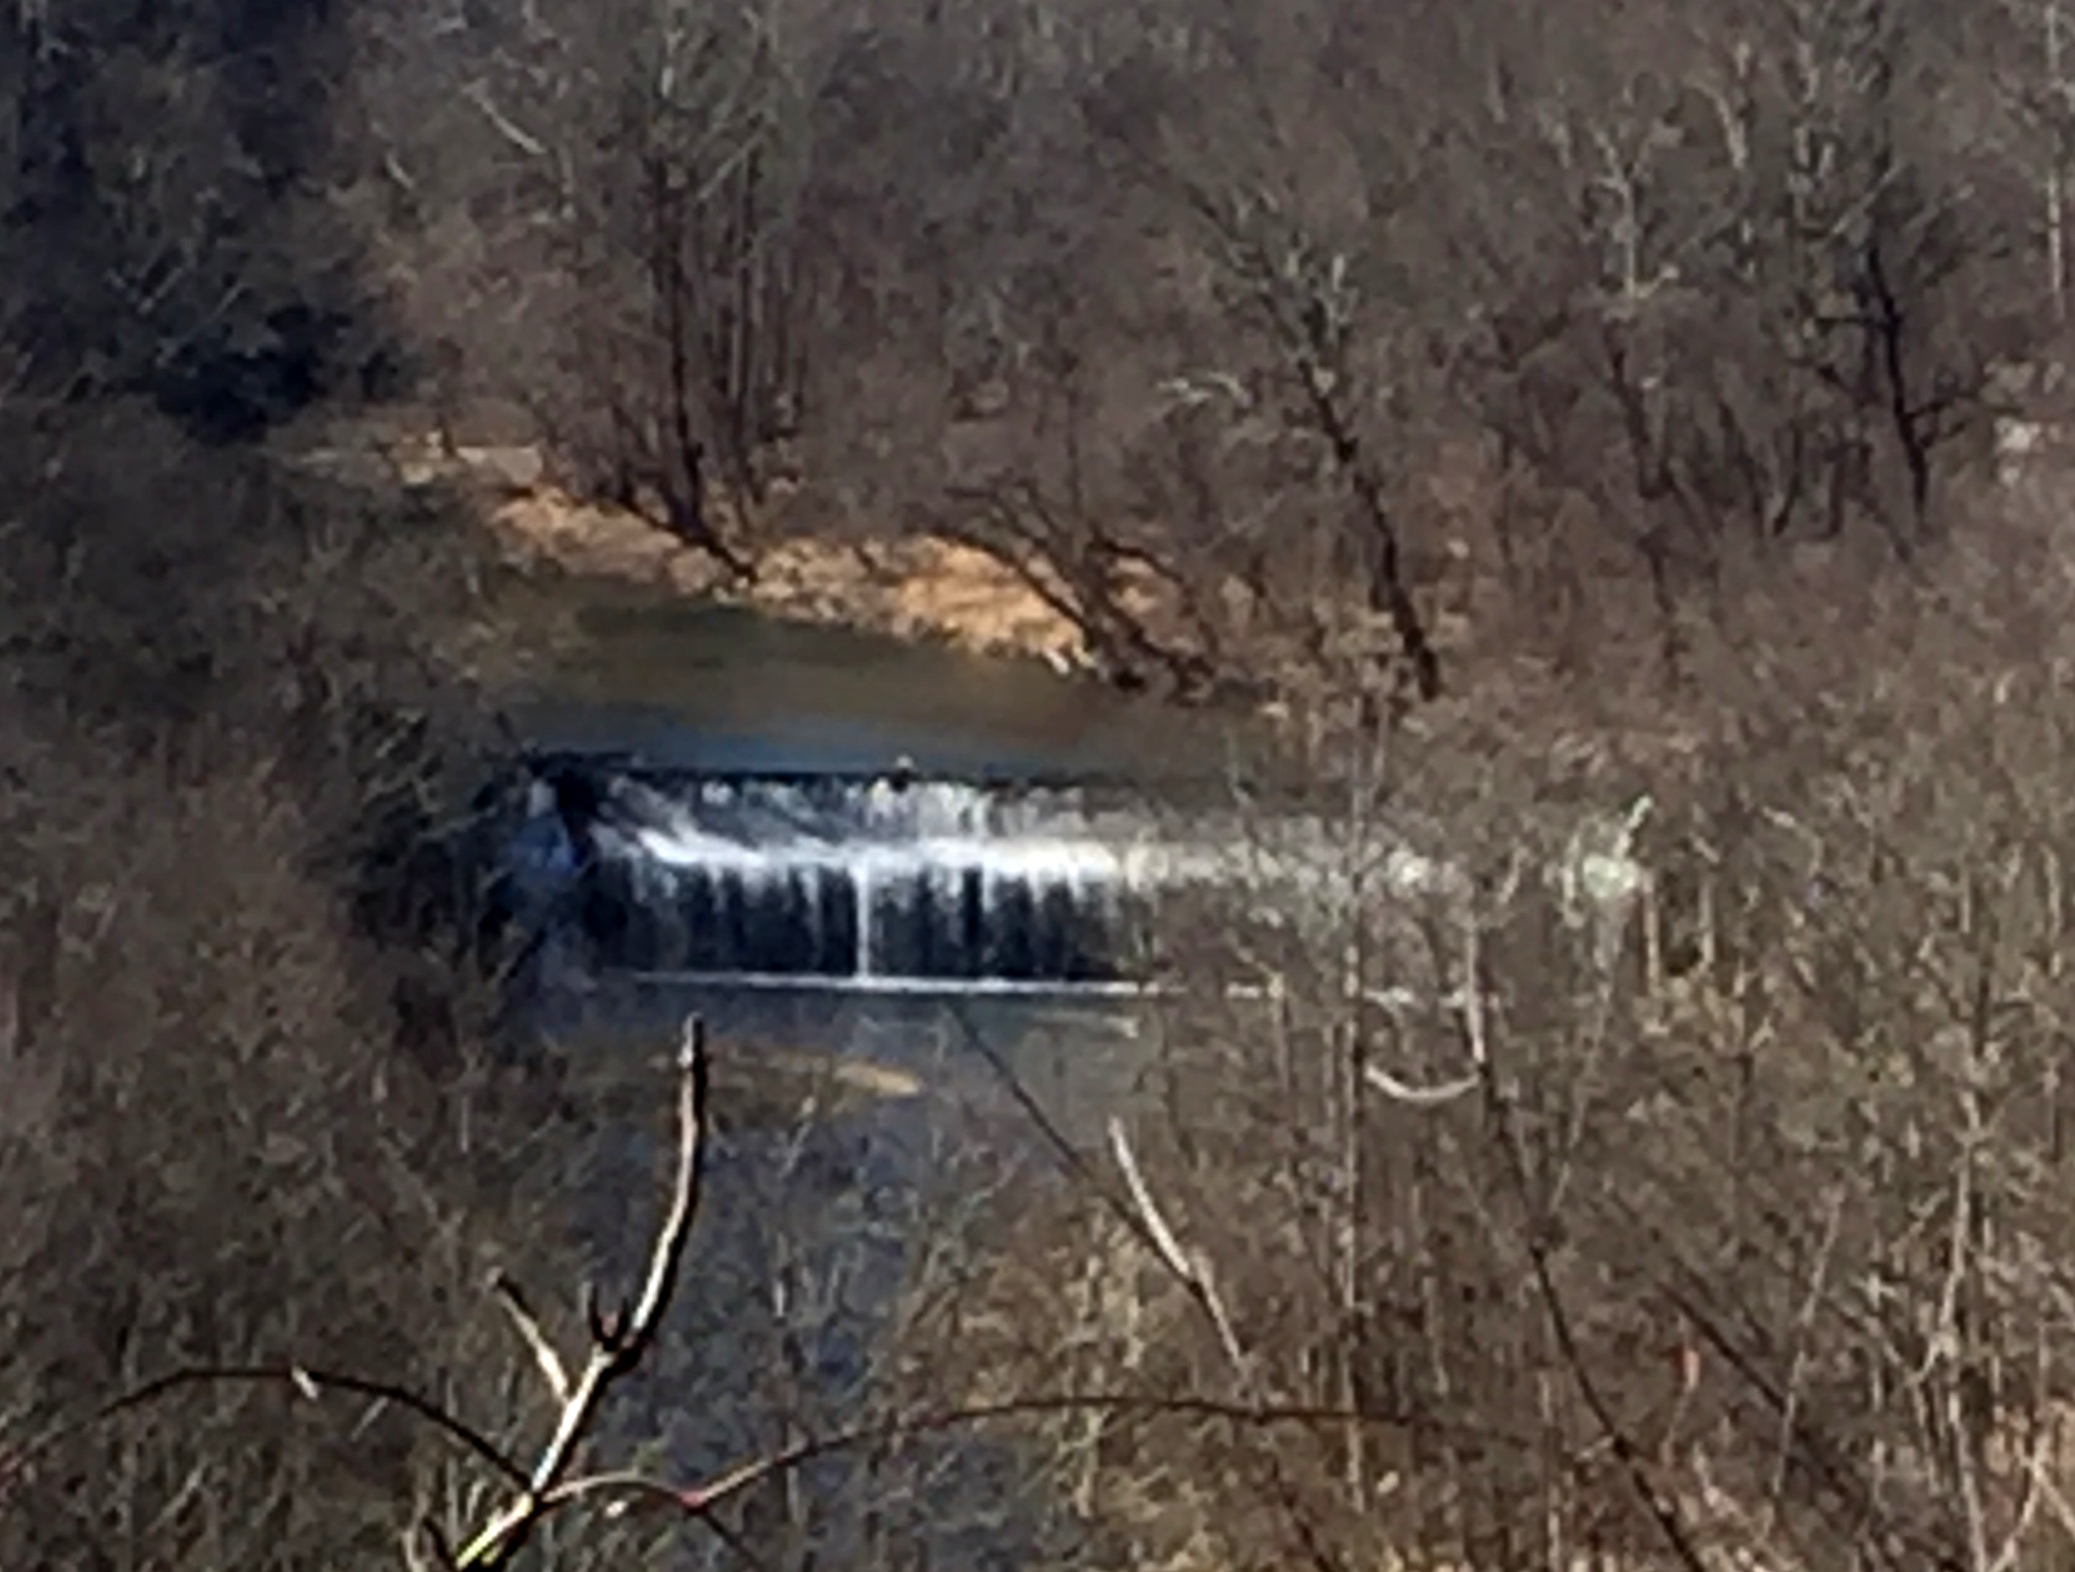
It looks like the state of Maryland is finally prepared to remove the Bloede Dam on the Patapsco River. The Maryland Department of Natural Resources (DNR) has been examining the impacts of the removal for about seven years and at last this old dam built in 1907 is on its way to the scrap heap. I ask everyone to give a rousing cheer for the state of Maryland. This will be the third dam removal on the Patapsco. The goal is to return the river to its natural free flowing state and restore passage up and down the river for fish and other aquatic animals, especially the migratory ones like shad, herring and eels. Think about it, these poor fish haven’t been able to return to their historic spawning grounds in over a hundred years. And on top of it all the Bloede Dam is a public safety hazard and has been so for years because it is no longer in use and it is easily accessible because of its location in the highly over used Patapsco State Park. There have been 3 deaths at the Bloede Dam just in the last 10 years.

Bloede Dam 2016

For those of you who don’t know where the heck the Patapsco River is, think Baltimore. The river’s watershed spans four counties in Maryland and drains the nasty Baltimore Inner Harbor as well as agricultural and suburban areas. It flows into the Chesapeake Bay which has been undergoing crisis level water quality issues for eons. There is a whole big federal government endeavor called the Chesapeake Bay Program which was established to “clean-up” the Bay at the cost of about $70 million a year.


The decision to remove the dam allows for the natural transportation down the river of the sediment backed up in the impoundment behind the dam structure. I was a bit surprised about the decision as I would think the sediment behind a dam in such an urbanized area would be full of contaminants. So I checked out the DNR decision documents on the release of the sediments and was surprised but happy to see a classic study of both the sediments to be released and the impacts on the environment and the hydrology of the river. The results can be found in two documents: 1) Bloede Dam Biogeochemical Impacts – An Analysis Based on Patapsco River Nutrient Balances by the University of Maryland Center for Environmental Science and 2) Bloede Dam Sediment Transport in the Patapsco River, produced by American Rivers. American Rivers is my favorite non-profit environmental organization of all time. In my opinion, most environmental non-profits are just loaded with lawyers who spend their time suing the Environmental Protection Agency and other government organizations. American Rivers is full of scientists who actually are doing something to improve the environment. The DNR has partnered with American Rivers along with a number of other state and federal organizations in the study of the dam removal.


The Bloede Dam impoundment contains approximately 312,000 cubic yards of sediment of which about half is coarse sand and gravel with the other half being silt. Twenty cores were taken of the sediments with 14 analyzed for contaminants. Miraculously no contaminants were found, not even mercury or polychlorinated biphenyl (PCB) which both bedevil other river systems. However there is phosphorus associated with the silt in the impoundment. Phosphorous and nitrogen are two of the main players in the continuing saga of poor water quality in the Chesapeake Bay. Extraordinary efforts are being made to reduce these two nutrients entry into the Bay because they contribute to algal blooms which deplete oxygen in the water. Oxygen depletion has resulted in the development of several dead spots in the Bay which are essentially no go zones for fish since fish are like us and need to breathe.


So the DNR was alarmed. After all you don’t want a big gulp of silt containing phosphorous rolling down the river into the Bay. A biogeochemical study was conducted to determine if the phosphorous in the river would result in any environmental impacts. A lot of work has been done on phosphorous in the last 20 years and much of it has been associated with studies of the Chesapeake Bay. Just because there is phosphorous in the sediment doesn’t mean that it is going to be released into the water. A lot of variables play into whether the phosphorous leaves its comfy home in the muck to become a dissolved phosphorous micronutrient available to feed the algae. Muck is not really a technical term but it is probably the best description of the organic and inorganic mixture of particles found in estuaries like the Chesapeake Bay. The researchers at the University of Maryland say the chief factors in the Bay area in the adsorption and desorption of phosphorous onto fluvial particulates are the presence of iron oxides and the conversion of iron oxides in low oxygen environments to the meaner, tougher, uglier iron sulfide species.


What does this mean? It means that there is a continuous stream of dissolved phosphorous entering Bay waters from sediments deposited in its low oxygen dead zones. As long as you have iron oxides precipitating in oxygenated waters than you will have phosphorous also precipitating from its dissolved form with both ending up in the sediment. Where you have iron oxides clinging to the muck already, then your phosphorous will cling to the muck too. Where there is low oxygen and the formation of iron sulfides then dissolved phosphorous will be released into the water. So according to the guys at the University the Maryland Center for Environmental Science the presence of oxygen controls the release of phosphorous.


Any phosphorus in suspended sediments flushing out of the Patapsco River into the Bay would then really occur after the sediments are deposited. The researcher used a model developed by the Chesapeake Bay Program to determine how many grams of phosphorous per meter per day were likely to enter the Chesapeake Bay after the destruction of the Bloede Dam. They then expanded the model to determine the yearly input of total phosphorus and dissolved phosphorus which would enter the Bay. They estimate 85,000 pounds of phosphorus are tied up in the silt behind the Bloede Dam. They assumed about 50 percent of the phosphorous was tightly bound up in the silt. The researchers also were able to use other studies to determine that most of the sediment would be spread out over the extent of the Patapsco River and would not be entering the Bay. Once any sediment makes its way to the Bay, the phosphorous will only be released to the water and available to algae under very low oxygen conditions. The researchers therefore concluded that there was very little concern from allowing a natural release of the sediments.


It’s a good thing because dredging the sediment and trucking it away for disposal was estimated to cost an additional $20 million and add a year to the dam removal schedule with trucks operating 24 hours a day to haul off the impoundment’s sediment.


The release of the sediment will definitely have short term impacts on the river downstream from the dam. The dam is about 11.5 miles upstream of the Patapsco River’s entrance to the Bay. Sediment release will result in muddy water as the sediments are picked up and moved downstream in the flow. How muddy depends on the amount of precipitation received following the dam’s removal. If there are heavy rain events then the sediment will move quickly downstream and it will take only 4 weeks to empty the impoundment. Little rain and it will take 6 months. There will be temporary effects of course. Sediment deposits are expected to be 4-6 feet immediately downstream of the dam. It will bury fish habitat, fill pools, and create sand bars but eventually the river will begin to recover its pre-dam profile. Hydrologic models predict within 6 years. A worthy achievement for some short term pain.

Hot Springs Risks and Rewards

Hot springs are rather an unusual topic for this blog since they don’t have widespread environmental impacts, but today’s post is written specifically for a friend of mine who is a hot springs addict. I’ve been trying for some years with no success to keep her from immersing herself in thermal springs that are outside of a controlled environment such as a spa or water park. So today’s post covers my litany of concerns with the practice of dipping oneself in a local hot spring found in an uncontrolled environment such as government managed forests or land. For the purposes of this post I will designate such hot springs as “uncontrolled hot springs.” Most uncontrolled hot springs are located in the west where my friend lives. In the east, hot springs generally are associated with spa resorts.


There are basically two ways hot springs become hot. Most often the water in the spring has been heated as a result of the natural thermal gradient of the earth. “Thermal gradient” is a fancy way of saying temperatures within the earth get warmer as depth from the surface increases. An example of a hot spring formed in this manner is Berkeley Springs, West Virginia where a young George Washington famously soaked his tired body after surveying the lands nearby. There are similar hot springs found along the valleys and walls of the Appalachian mountain chain from New York State to Georgia. The mechanism attributed to the formation of the thermal springs in these locations is the percolation of surface and ground water deep into the earth through fractures and faults in the highly folded rocks of the Appalachians. According to calculations by the U.S. Geological Survey, subsurface water descends through massive layers of rock reaching depths of up to a mile. These superheated waters then flow along and through the dipping layers of the rock formations until they make an exit to the surface along a convenient fault or fracture. Sandstone and limestone make up a large amount of the rock hosting hot spring development in the Appalachians.


The other manner in which hot springs form is through the penetration of subsurface waters to vast depths where they are superheated by rocks in contact with underground magma chambers. Yellowstone National Park is the classic example of such a place where supercharged boiling water is emitted from rock in the form of geysers like Old Faithful and in less restive thermal pools as well. Yellowstone is not the only place where hot springs are the result of water being heated by hot rocks in contact with magma. Many parts of California and Nevada, as well as other western states, have hot springs that are the result of this process.


So water in hot springs comes from deep circulation of water through rock layers. During its journey, the hot water picks up all sorts of minerals. It is the reason why hot springs are also sometimes called mineral springs. The springs generally contain high dissolved solids like potassium, sodium and carbonate. But in many cases, they also pick up metals like cadmium, arsenic, mercury, and lead.


There is very little recent scientific literature on the amount of various metals to be found in uncontrolled hot springs. Most water analyses of these hot springs were conducted in the 1970’s when scientists were looking at possible geothermal energy development nearby. So if you are visiting a hot spring outside of a spa environment, there are no water analyses available to determine the metal levels of the water in which you are sitting. Yellowstone National Park is one of the exceptions. The U.S. Geological Survey has in the last decade sampled both hot springs and geysers to determine their mineral content. Thermal hot springs in Yellowstone have very low levels of cadmium, arsenic, mercury and lead – all are in the part per million range. Arsenic in the Yellowstone springs almost always exceeds the U.S. Environmental Protection Agency’s (EPA) drinking water standards. Of course I know most reasonable people are not drinking the water from thermal pools in Yellowstone or any other hot spring. And most reasonable people are not out sitting in thermal hot springs in Yellowstone either, unless they have a strong desire to be boiled to death. And hey, sitting in water containing metals isn’t a problem because you’re not going to absorb any of those metals through your skin, right? Wrong, there’s actually a formula the EPA uses in risk assessments to determine the amount of metal in water that is absorbed through the skin. EPA uses the scenario of showering or bathing as the contact mechanism with the metals in water. The calculation accounts for number of events per day of these activities. Hopefully most adults are showering at least once a day. If you’re spending a lot of time in uncontrolled hot springs then you would need to add that metal exposure to your daily bathing events.


Okay really, I’m not going to say there’s a lot of health risk to people from absorbing metal while soaking in a hot spring. It’s really the gases welling up in these hot springs which could be more of an environmental health concern. Radon would be one of the chief concerns from a health perspective. EPA’s air standard for radon is 4 pico Curies per liter (pCi/L). Where radon is found in hot springs, it could very well exceed this number. Again there is nothing much in the scientific literature on collection of radon data at hot springs, but at least in several cases monitored by the U.S Geological Survey and the National Institute of Occupational Health and Safety (NIOSH), radon has exceeded the EPA standard. For example NIOSH found radon levels above EPA standards in one of the National Park Services’ springs in Hot Springs, Arkansas and the Geological Survey has monitored radon in Alhambra Hot Springs in southwest Montana. Radon is not the only gas escaping from hot springs. Those little bubbles you see in the water are carbon dioxide gas. Nitrogen and hydrogen sulfide gases are also common. So the air around hot springs will contain these gases. There was a recorded asphyxiation by carbon dioxide in an uncontrolled hot spring on public land at Soda Springs, California in 2015.


Another health concern with hot springs is the presence of pathogens such as amoebas and bacteria that thrive in warm and hot springs. The three main pathogens you might find in a hot spring are Legionella species, Acanthamoeba, and Naegleria fowleri. Legionella is of course the bacteria which causes Legionnaire’s disease. Outbreaks of Legionnaire’s disease have occurred in hot spring bathing areas in Japan in the past. Acanthamoeba is an amoeba that causes eye infections. And Naegleria fowleri is an amoeba that will eat your brain. Really I’m not kidding. This amoeba causes amebic meningoencephalitis which generally kills you within days. There are recorded cases of people who have died from amebic meningoencephalitis acquired during a visit to an uncontrolled hot spring. The amoeba enters your body through the nose, so the recommendation is not to put your head underwater. But really do you want to be sitting in a hot spring with this amoeba?

Of course the number one cause of death in uncontrolled hot springs is being boiled alive. This is actually more common than you would think. Water at 120 degrees Fahrenheit can scald you. Spend much time in a hot spring with waters exceeding this temperature and you will boil. Readers are probably aware of the tragic death which occurred in early 2017 when a young man accidentally fell into a thermal pool in Yellowstone National Park and was boiled to death. It was very sensational because his body was reported to have been dissolved before it could be retrieved. Not only are the hot springs in Yellowstone extremely hot but many of them are acidic with pH’s of 2. Hydrochloric acid is pH 2. A former park ranger has actually written an account of all the people who’ve died in hot springs in Yellowstone – 22 from his last account. In Idaho and Nevada, there have been reported cases of people being severely burned trying to rescue dogs from the scalding waters of a hot spring and a few of them have unfortunately died from their injuries. Even hot springs where people have bathed before without injury can suddenly and lethally change temperature. This generally occurs in areas where the water in thermal springs is heated by superhot rock in contact with magma. Hot Creek in California’s Long Valley Caldera is a notable example of hot springs which can drastically change temperatures as a result of geologic activity underground which seals off one fissure to the surface and opens another. There are reports of over a dozen people having died while bathing in the hot springs there. Sudden temperature changes could happen at any uncontrolled hot spring which is produced by active volcanism in the subsurface.

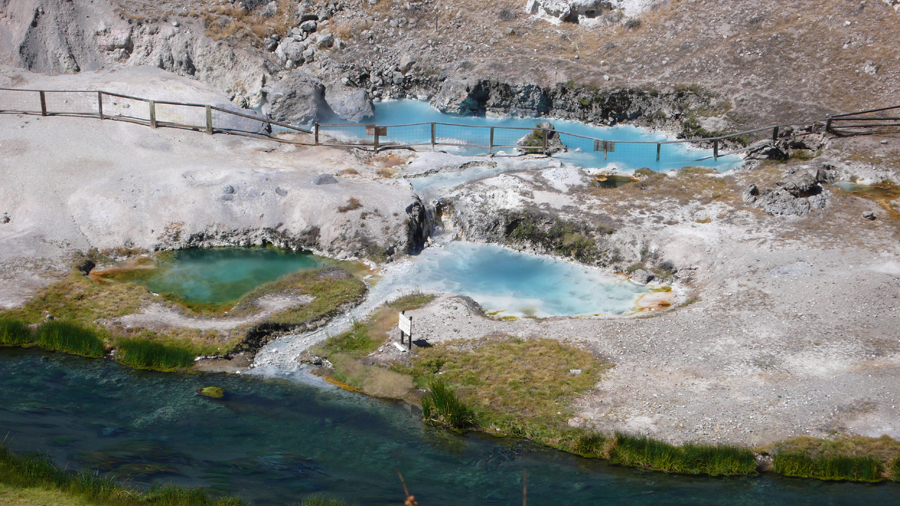
Hot Creek California Thermal Pools, from the U.S. Geological Survey website.


So this post was entitled Hot Springs: Risks and Rewards, but all you’ve read so far are the risks. What are the rewards? Well in a nice controlled spa environment, hot springs can be very relaxing and enjoyable. People have “taken the waters” for millennia and there are many health spas in Europe which still use hot springs therapeutically for the treatment of several diseases, including arthritis and psoriasis. Therapeutic treatment in hot springs was common in the United States for such illnesses until the early seventies when medical science actually started producing some pharmaceuticals which treat the symptoms of these diseases. The therapeutic use of spring water is called balneology. There have been a number of compilation studies examining the research conducted on the effectiveness of the therapeutic use of hot mineral water to alleviate symptoms of arthritis and other diseases. Unfortunately the studies all have the same conclusions. The research projects conducted have not been scientifically sufficient to conclude whether there are benefits achieved from balneotherapy. It doesn’t mean there aren’t benefits, it just means there is not a lot of conclusive evidence that such treatment works. But enjoy your soak in a hot spring anyway; just make sure it is in a controlled spa environment.

Copper and Water Quality

A few of my readers know that I’m a sailor. My husband and I have a 32 foot sailboat, which we keep it in a marina on the Chesapeake Bay. Every year the boat gets hauled out of the water for the winter. Before the boat went back in the water this year, we had the hull painted. Copper based paints are used on boat hulls to prevent the growth of critters and sprouts. I was curious about how copper paints prevent your hull from becoming a Noah’s ark of algae and barnacles, so I have been doing a little reading on the subject. There have been a number of copper based paint studies (also grandly called Anti Fouling Systems) conducted by the U. S. Environmental Protection Agency (EPA) and the California Environmental Protection Agency (Cal-EPA). According to the two environmental organizations, the most commonly used boat paints leach copper into the water and form a toxic protective shield around the boat hull to prevent the attachment of aquatic organisms. Copper is a toxin for many aquatic plants and animals. In fact it is a toxin for many terrestrial plants and animals. Copper is a widely used pesticide in the agricultural industry where it’s employed to eliminate bacteria, fungus, and weeds.  After a few years, the leaching rate of copper from the paint on a boat hull decreases and the boat has to be painted once again. It costs a couple of thousand dollars every time, so this is not an incidental expense.


The most common form of copper in the antifouling paints is cuprous oxide.  I didn’t realize how much copper is actually in the paint. Cuprous oxide paint is 30 to 60 percent copper. So a lot of copper is going into the water in marinas where recreational boats spend most of their time. The Navy actually did some studies in San Diego Bay back in the 1990s and found that 98 % of the copper in the bay came from antifouling paints on boats. They calculated that each boat in the bay was releasing 1.8 pounds of copper a year just while they were sitting at the dock in the marina. According to the Navy, most of the copper in the paint was released through the leaching process. A smaller amount of copper was released during underwater cleaning of boat hulls. California does seem to have the largest problem with copper in the waters of their marinas, so much so that a marina in California has been listed as an impaired water body under 303(d) of the Clean Water Act. Once a water body is listed as impaired under the Clean Water Act, a state must institute a Total Maximum Daily Load (TMDL) for it. A TMDL basically sets the maximum amount of a particular pollutant that a water body can receive and still meet water quality standards. As you can imagine, the designation of the marina as an impaired water body has now posed a serious problem for the marina’s boaters and California’s environmental regulators. Since hull paint is considered the main contributor of copper into the marina’s waters, the Cal-EPA has instituted a study of alternate antifouling systems – hull coatings without copper – in hopes of finding one which will be effective and economical enough to be used on recreational boats so that water quality there can be improved.


The water quality criteria established by the EPA for copper in marine waters and estuaries is really quite low. It has been revised multiple times over the last 20 years. The revisions have sought to produce a more scientifically justified approach for the development of the water quality criteria. The latest approach in setting the copper water quality criteria was issued in the July 2016 draft guidance: Aquatic Life Ambient Estuarine/Marine Water Quality Criteria for Copper, EPA-822-P-16-001. Scientists at EPA have known for many years that the toxicity of copper in water is dependent upon the water’s salinity (the amount of dissolved solids in the water), the temperature, the pH (the measure of acidity), and the amount of natural dissolved organic carbon. EPA scientists realized variations in these parameters influence the amount of dissolved copper in water. Dissolved copper is the culprit in the metal’s toxicity to aquatic organisms. Toxicity is reduced when copper in the aquatic environment binds with other elements and organic carbon to form ligands. Ligands are a little difficult to understand but simply put, they are complexes of molecules binding together to form a new substance. So for example, if there’s a lot of natural dissolved carbon in the water, it might bind with copper to form a ligand. Copper can also form complex ions with other ions and ligands in the water. Copper tied up in ligands and complex ions is not available to plants and critters, thereby making the water less toxic to them.


Interestingly copper has a similar binding behavior when it interacts with aquatic organisms. It binds to the biota’s gills and surface membranes. Although biota also ingests copper in the water, the scientists at EPA do not consider it a pathway for the toxin to negatively impact the organisms. It is the binding of copper to the gills and surface membranes of marine fish and invertebrates which is the major factor in coppers toxicity to them. EPA has a name for it. They call it the biotic ligand. Therefore to take into account the complexity of the world at large which is obviously not a simple system, EPA has developed a model called the “Biotic Ligand Model” to determine based on the specific temperature, pH, salinity, and amount of dissolved carbon what the aquatic criteria is for any particular marine or estuarine environment you might encounter. This makes it a little tough for state regulators because then they must sample the waters in question for these parameters and run a complex computer model to determine the specific water quality criteria for any given water body.


When setting water quality criteria, EPA usually bases it on the organism in the water which is most sensitive to a given pollutant. Arthropods are pretty sensitive to copper, after all the reason boaters use copper paint is to keep barnacles from attaching to their boat hulls. Although in the grand scheme of things I don’t think anybody is really worried about barnacles. Commercial species of mollusks like mussels, oysters and abalone are also extremely sensitive to copper. EPA was able to collect acute toxicity data on 89 different estuarine and marine fish and invertebrates. In simple terms acute toxicity means that biota aren’t going to live very long when exposed to an acutely toxic concentration of a pollutant. There were far less data available on chronic toxicity. Chronic toxicity happens when exposure to a pollutant results in conditions which are not immediately fatal to an organism, for example reproductive anomalies (we call these birth defects).


With EPA’s Biotic Ligand Model one can pop the temperature, pH, dissolved carbon and salinity values of your local marine/estuarine water into the model and come up with a numeric value for copper which should not be exceeded. So for example, if your water is 68 degrees Fahrenheit, the pH is 8, the dissolved carbon is 1.0 milligram per liter, and salinity is 32 parts per thousand than dissolved copper shouldn’t exceed 2.0 micrograms per liter on average more than once every 3 years, and the 4 day average shouldn’t exceed 1.3 micrograms of dissolved copper per liter more than once every 3 years. Complicated right?


These are extremely low values. The current acute value for copper is 3.1 micrograms per liter and the chronic is 4.8. The water quality criteria are of course guidelines. They are not regulatory in nature. They are there for state regulators to use in determining protection measures for aquatic life. As mentioned above, California has already designated a San Diego area marina as an impaired water body. Other places EPA has suggested might have copper levels impacting aquatic life are certain locations within the Chesapeake Bay and some port areas of Florida. As of yet, I know of no other marinas which have been designated as impaired waters. Alternatives to copper paint are fairly expensive and can potentially double the price for applying an antifouling coating to a boat hull. The American Coatings Association and the International Copper Association have already commented on EPA’s 2016 draft guidance. The organizations submitted a number of technical comments in regard to the Biotic Ligand Model and the conservative values produced by it. They are worried that the new proposed copper water quality criteria will result in unrealistically low TMDLs for other marinas.