All posts by Waterblogger

The author has 35 years of environmental experience primarily with oil and gas and mining development, abandoned mines, and water issues in the private and public sector. A colleague once described the author as being a member of every weird water group in the West. A former Department of the Interior employee, the author received the Department's highest award for Distinguished Service in 2015.

Hydraulic Fracturing: Impacts from Produced Water

Today is my final post covering the U.S. Environmental Protection Agency’s (EPA) December 16, 2016 report: “Hydraulic Fracturing for Oil and Gas: Impacts from the Hydraulic Fracturing Water Cycle on Drinking Water Resources in the U.S.”  I reviewed EPA’s analysis of the potential for drinking water contamination during the oil and gas industry’s management of produced water. EPA includes within the definition of produced water both the fluid which has been injected down a well to hydraulically fracture oil and gas rock formations and the normally salty water contained within the rock formation itself. Once rocks are fractured and the pressure is released on a well undergoing hydraulic fracturing, part of the hydraulic fracturing fluid and some of the salty formation water flow back up the well to the surface. The management of the produced water once it reaches the surface is important to safeguarding drinking water resources.


Spills are probably the number one problem with waste handling in most industries, so it is not surprising that there are multiple ways produced water is spilled at oil and gas wells being drilled or hydraulically fractured. We are all too familiar with the blowout and spill which occurred in the Gulf of Mexico in 2010. Who did not see the underwater videos of oil and brine pouring out of the well on the sea floor? After all it went on for 5 months. Blowouts occur on-shore as well. When they occur at a well being fractured, it can result in oil and gas, formation water, and hydraulic fracturing fluid all coming back up the well and being released at the ground surface. If the well casing is damaged during the blowout then there is also the potential of produced water being released into rock formations with groundwater aquifers. Fortunately blowouts are very rare. When blowouts occur on-shore, it is easier to stop the flow and to clean-up the mess. Just as problematic, though not as spectacular, are the spills of produced water from day to day management activities.


When oil and gas wells are new, they produce more water. Horizontal wells produce more water than vertical wells. More hydraulic fracturing chemicals will be in the produced water during the early life of a well. Over time the produced water will be composed predominantly of the salty formation water from the oil and gas formation. Unfortunately the formation water is not benign. It is brine and full of chlorine, bromine, metals, organic oil and gas constituents, and naturally occurring radioactive minerals. There is a lot of this produced water coming up from active oil and gas wells all over the United States, whether they have been hydraulically fractured or not. EPA estimates horizontal wells produce 1100 gallons of produced water per day and vertical wells about 500 gallons a day. But the exact volume depends on the actual formation being fractured. The rock formation also determines what the composition of the produced water will be. For example in the Marcellus Shale, the produced water contains more barium and strontium. But even within a single rock formation like the Marcellus, the composition can vary widely. EPA has documented salinities of between 1500 and 300,000 milligrams per liter in the Marcellus Shale. The produced water characteristics of hydraulically fractured wells are not substantially different from produced waters out of wells which have not been hydraulically fractured. The main difference between the two types of water would be the chemicals used in hydraulic fracturing; chemicals like ethylene glycol, propylene glycols, toluene, xylene, 2-butanone, acetone and many others. Chemical additives are a small amount of the total fluid used for hydraulic fracturing, on average less than 1 percent. Most of the fluid used to fracture a well is simply water.


When the produced water reaches the surface, it must be managed. Either it is collected in tanks or discharged into pits. Thank goodness state governments have ended the practice of allowing discharge into unlined pits. According to EPA, unlined pits have been the source of contamination to water in a number of cases in New Mexico, southwest Pennsylvania and possibly in Texas. But lined pits can leak too if the liner isn’t installed adequately. Produced water is often piped to pits or storage. There have been a number of incidents where pipelines have broken or valves have been accidentally left open. In 2015, North Dakota had one of the largest pipeline spills of produced water. About 2.9 million gallons of produced water were released.


Of course pipelines sometimes leak. So does other equipment the produced water passes through, such as hoses. Even storage containers leak. The best data that EPA was able to come up with in examining the various sources of spills was from North Dakota. There were 552 leaks or spills between 2012 and 2013.  EPA says that was somewhere between 5 – 7 releases of produced water per 100 active production wells. Most of the produced water spills were the result of equipment leaks and overflows of tanks. This seems like a lot of spills to me. Of course not every spill was a big one; they ranged from 170 gallons to 74,000 gallons.


Pits and storage containers are not the final resting place for produced water. With the amount of water being produced over the lifetime of an oil and gas well, the water has to be permanently disposed of somewhere. Most states have lots of disposal injection wells permitted under the Underground Injection Control regulations. So in the majority of oil and gas producing states, the produced water is piped or trucked to an injection well for disposal. Injection wells are installed into permeable rock formations at great depths and are specifically designed for final disposal of liquid waste. EPA says in 2012, there were 26,400 disposal injection wells and 65 % of them were located in Texas, Oklahoma and Kansas. EPA cites a study that estimates 93 % of all produced water in the U.S. is injected into disposal wells.


Interestingly enough Pennsylvania only has 9 permitted underground injection wells in the whole state. Trucking produced water to another state where there is a disposal well is pretty expensive, except in southwest Pennsylvania. At one time produced water in Pennsylvania was being sent to Publically Owned Treatment Works (POTWs). These facilities treat municipal waste. Produced water was also being shipped to commercial facilities called Centralized Waste Treatment (CWT). This is no longer allowed in Pennsylvania because neither POTWs nor CWTs were able to treat the produced water from the Marcellus adequately and it was causing problems for downstream drinking water suppliers. Today over 80 % of produced water in Pennsylvania is being treated and reused as water to hydraulically fracture oil and gas wells.


In the 10 years it has taken EPA to write their report on the impact of hydraulic fracturing on drinking water resources, a lot of improvements have been made in management of produced water which consequently has reduced potential impact on drinking water. It looks like more improvements could certainly be made in produced water management. Many of the produced water spills are caused by human error or equipment failure. EPA was unable to quantify the number of spills of produced water nationally or the affects on drinking water sources. However, they did examine a few states which keep spill records. EPA found that of 575 produced water spills in California between 2009 and 2014, 18 percent impacted surface water. Quality improvement in produced water handling could reduce the number of spills and impacts on drinking water resources.
Hydraulic Fracturing: Movement of Gas and Fluid in the Subsurface

Today’s post looks at ways injected hydraulic fracturing fluid might move through the subsurface and contaminate groundwater. The information in this post is based on the U.S. Environmental Protection Agency’s (EPA) December 16, 2016 report: “Hydraulic Fracturing for Oil and Gas: Impacts from the Hydraulic Fracturing Water Cycle on Drinking Water Resources in the U.S.”


Wells are constructed to withstand the pressures applied during injection of hydraulic fracturing fluid. The fluid is mostly water and sand with on average about 1 % chemical additives. Wells are constructed by inserting steel casing down a borehole and cementing it next to the rock formation. The cement prevents fluid and gas from coming back up along the sides of the casing. State regulators generally require protection of groundwater resources and so casings are cemented (at a minimum) from the surface to below the groundwater zones. The goal of hydraulic fracturing is to inject solution down the hole under enough pressure to produce long horizontal and vertical fractures in the oil and gas formation. The sand in the solution then props the fractures open, so the gas and oil can flow out of the rock and up the interior of the casing to the surface. Once the pressure on the well is released, most of the hydraulic fracturing fluid comes back up the well and is captured in tanks for disposal. It is the fate of the fraction of fluid lost in the fractures which is a concern in EPA’s study. There are fluids and minerals already existing in the oil and gas formation. Some of these fluids and minerals come back up the well with the hydraulic fracturing fluid. EPA’s report examines whether these naturally occurring fluids and minerals can be activated by the hydraulic fracturing process and move through the subsurface. EPA is also concerned with whether the hydraulic fracturing process might cause gas in the targeted oil and gas formation or in the overlying rocks to move through the subsurface into groundwater.


Unfortunately the EPA has only been able to identify a limited amount of research on fluid and gas movement once an oil or gas well has been hydraulically fractured.

As a result there are a lot of limitations on EPA’s ability to provide any definitive conclusions on fate and transport of gas, hydraulic fracturing fluid, or naturally occurring groundwater and minerals through the subsurface. EPA examines two pathways fluids and gas might move into groundwater during and after hydraulic fracturing. The first pathway is a result of the age old method of human frailty, in other words, a bad well design or poor construction of the well. Also included in this pathway is the lack of permanence of human construction or your basic entropy – the eventual degradation of the steel casing or cement. The second pathway EPA examined is the movement of gas and fluid through the fractures created by hydraulic fracturing into naturally existing fractures, faults, and nearby operating or abandoned oil and gas wells, or in other words, unintended consequences.


What kind of scientific or technical evidence did EPA find to support the existence of these two pathways? First there’s the technical data EPA collected from the oil and gas industry, although it is incomplete. There is the research by non-EPA scientists who have examined data collected from the oil industry or who have produced independent data themselves, and then there is groundwater modeling. As someone who has conducted and used groundwater models, I always caution on the usefulness of this methodology. There are so many variables in the subsurface; it is often hard to use models as more than just a tool to assess the many probabilities which might occur. But in this case, groundwater modeling has provided some interesting and pretty definitive insights into what can happen to fluids and stray gas during and after hydraulic fracturing.


So did research show there are subsurface pathways through which groundwater contamination can occur during and after hydraulic fracturing takes place? EPA reviewed data collected from the oil and gas industry and found that in roughly 3 % of wells hydraulically fractured, there was a mechanical failure of the well. This means some fluid or gas may have escaped along the outside of the casing during the hydraulic fracturing process. Where it went is a guess. Just because the casing or cement failed, it doesn’t mean fluid or gas moved into groundwater. Only in about 0.5 % of these cases did the well not have cement or some other type of barrier protecting the groundwater. Of course there are some notable well failures which have contaminated groundwater, like the ruptured casing resulting in a large surface spill in Killdeer, North Dakota during 2010. Based on groundwater chemistry, scientists think there are also some hydraulically fractured gas wells in the Marcellus Shale in Pennsylvania which have contaminated drinking water resources with natural gas as a result of poorly cemented casing. And there’s another incident in Ohio where gas moving up the exterior of casing into groundwater was thought to have been caused by poor cementing. A number of oil and gas wells being hydraulically fractured are not new wells. Of the oil and gas wells EPA examined about 19 % were older wells. They ranged in age from 8 days to 51 years. EPA noted there were more casing and cement failures in these older wells. So yes there is a limited amount of data showing oil and gas wells being hydraulically fractured can fail and be a pathway for groundwater contamination.


What about movement of fluid and gas through new and existing fractures? What technical evidence did EPA find to determine if this was a clear pathway for contamination? Studies have shown that hydraulic fracturing results in vertical fractures in rocks at depths greater than 2000 feet and horizontal fractures in rocks shallower than 2000 feet. EPA was interested to know if fractures can extend out of the rock formation being fractured and into overlying rocks containing groundwater. EPA cites studies showing vertical fractures from hydraulic fracturing operations can extend several thousand feet upward, however fracture length is really dependent on the rock formation being fractured. For example in the Marcellus Shale, most vertical fractures only extend for a few hundred feet. EPA argues the depth of most oil and gas rock formations and their great distances from overlying aquifers prevents movement of fluids and gas along induced fractures into drinking water. Based on the data reviewed by EPA, only 20 % of wells had less than 2000 feet between the shallowest point where fractures could extend upward and the base of the drinking water formation.  This doesn’t mean fractures are not a pathway through which groundwater could be contaminated. It just means it is highly unlikely in most cases. EPA has more concern about this potential pathway for contamination when hydraulic fracturing is either in the same formation as a drinking water resource or a drinking water resource is less than 200 vertical feet from the oil and gas formation, as occurs in several places in Wyoming and California.


EPA examined several studies assessing the likelihood of what happens to hydraulic fracturing fluid which does not come back up a well once a well is depressurized. These fluids are called “leak off” and most studies show they are absorbed onto clays or are inhibited from moving out of the local area of the well by various physical forces in the subsurface. You’ve got to remember, the rocks being fractured lack permeability (the ability of liquid and gas to move through them.) It’s why the rocks are being fractured in the first place. But then again, some studies have shown the “leak off” fluid can displace gases in the pore space, which means until the oil and gas well starts operating and sucking up all the oil and gas in the area there is a period when you might have some movement of the gas into and along the fractures. Most modeling studies show the gas shouldn’t reach overlying drinking water resources without a direct conduit upward like a fault or an abandoned well. And then there are a few conflicting studies, where natural gas from underlying oil and gas formations has been found in shallow aquifers and EPA has been unable to identify a clear subsurface conduit.


So has EPA proved the potential of poorly constructed and damaged wells to transmit gas and fluid to drinking water resources – yes and no. They have certainly shown a few documented cases where contamination has occurred as a result of poor well construction and well failure. EPA has not however provided a good thesis for how frequently contamination along this pathway occurs. Not their fault – there is simply not a lot of available data which EPA could rely on to make such a determination. How about the potential pathway along natural fractures, faults, and abandoned wells? Has EPA proven or disproven the existence of such routes for fluid and gas movement and the degree of impacts groundwater is suffering as a result? Again yes and no – EPA has cited a couple of studies which have shown direct movement of gas up uncemented casing into natural fractures and other subsurface features then into ground and surface water. But then the modeling of such scenarios presented in the EPA report pretty clearly shows that once production starts all gas and liquids should flow into the production well and not be migrating elsewhere.


EPA states “The limited amount of available information hinders our ability to evaluate how frequently drinking water impacts are occurring, the probability that these impacts occur, or to what extent they are tied to specific well construction, operation and maintenance practices. This significantly limits our ability to evaluate the aggregate potential for hydraulic fracturing operations to affect drinking water resources or to identify the potential cause of drinking water contamination in areas where hydraulic fracturing occurs.”

Frac Hits

“Frac hits” sounds a little bit like a “best of album”, maybe a “best of album” for the oil and gas industry. But no, frac hits are something the oil and gas industry doesn’t want. Why? Because when a frac hit occurs then it means the horizontal fractures produced during hydraulic fracturing of a well have either intersected a nearby (offset) well or the fractures that were produced by hydraulic fracturing in a nearby well. How does an oil and gas operator know there has been a frac hit? Well the operator of the nearby well is going to be sure to let them know, because it often reduces the production of oil and gas and raises the pressure in the wellbore of their well. It can also introduce hydraulic fracturing fluid into a nearby well, which then may travel up the borehole and spill out on the surface. An increase in pressure, as well as the extension of fractures into the rock formation around a nearby well, can also damage the casing and cement. Cemented casing protects overlying rock formations from oil and gas coming up the sides of the well and possibly getting into groundwater. So a frac hit is not particularly popular in the oil and gas industry.


Frac hits occur more often when oil and gas wells are located close together. The Environmental Protection Agency in their December 16, 2016 report –“Hydraulic Fracturing for Oil and Gas: Impacts from the Hydraulic Fracturing Water Cycle on Drinking Water Resources in the U.S.” – states most frac hits occur when wells are less than 1100 feet from one another. But frac hits have also occurred in oil and gas wells up to 8422 feet away from a well being hydraulically fractured. That’s over a mile away.


Most frac hits are located in areas where the oil and gas rock formation is shallow, because predominantly horizontal fractures are formed. Deeper rock formations develop predominantly vertical fractures. Rock formations at depth are under greater vertical pressure from the overlying rock formations, which results in more upward extension of fractures. Shallower formations don’t have much in the way of vertical pressure from overlying rock, so they fracture outward or horizontally.


Just like producing oil and gas wells, nearby abandoned wells can be affected by hydraulic fracturing. Abandoned wells are old wells which are no longer used. They may have been plugged with cement. Other wells were often just left with open boreholes. It depends on the wells age and what the state regulations required at the time of abandonment. For example and according to EPA:  Pennsylvania’s abandonment regulations for oil and gas wells were not issued until 1957. The state’s records show there were 176,000 oil and gas wells abandoned prior to 1957. I was surprised at the number of wells. You never think of Pennsylvania as being a major oil and gas state, even though the first oil and gas well in the United States was drilled there. In fact, the state’s records show that around 300,000 oil and gas wells were drilled in Pennsylvania prior to 1957. So only a little over 100,000 wells would have been properly plugged under state regulations. These old abandoned wells are sometimes near the new wells being drilled today in Pennsylvania. Old wells, even when they were plugged with cement, are probably now deteriorating. Nothing lasts forever, especially cement and steel casing.  So if one of these old deteriorating or open borehole wells is intersected by new hydraulically induced fractures, then some interesting things can occur. For example EPA cites an abandoned well in Tioga County, Pennsylvania which received a frac hit as a result of a newly drilled gas well being hydraulically fractured. The abandoned well produced a 30 foot geyser of brine for more than a week.


So how do frac hits affect water resources? Although not a major pathway for gas or contaminants to enter drinking water zones, EPA’s research shows frac hits are a potential concern in areas where shallow oil and gas is being developed, producing wells and abandoned wells are abundant, and a groundwater source is being actively used by households. In addition, if surface spills from frac hits occur then contamination of nearby surface waters and shallow groundwater may also be a concern.

Hydraulic Fracturing Impacts on Drinking Water – Chemical Spills

I have been writing a series of posts over the last month on the final report from the U.S. Environmental Protection Agency (EPA) covering the environmental impacts of hydraulic fracturing of oil and gas wells on drinking water resources. The report is entitled:  “Hydraulic Fracturing for Oil and Gas: Impacts from the Hydraulic Fracturing Water Cycle on Drinking Water Resources in the United States” (EPA-600-R-16-236Fa, December 13, 2016.) Today’s post concerns the potential impacts of chemical spills during the hydraulic fracturing process. This is my fourth post on the report overall and I will admit up front, it’s the worst post I have ever written. Not my fault. Unfortunately, there is just a total lack of quality data in the part of EPA’s report which covers chemical spills at oil and gas well sites being hydraulic fractured.


Hydraulic fracturing is not the only industry where mixing and transferring chemicals and fluids create spills. Spills happen in all sorts of industries and with all sorts of transportation. If you have worked in the environmental field for a while then you know chemical spills are still a problem throughout the United States, even though regulators and companies alike have worked aggressively to prevent them over the last forty odd years. I thought hazardous materials spill responders would all be out of a job by now. Hah, not so. The reason they’re not all collecting unemployment is mostly due to the human element involved in the process of mixing or transferring chemicals – in other words you and I screwing things up.


For their report, the EPA has sought to quantify the number and type of chemicals spilled at well sites which have undergone hydraulic fracturing and to determine the causes of the spills. EPA used data gathered by state governments and industry over a period of six years starting in 2006. EPA sorted through all this data and drew some conclusions.


For example, EPA learned through their data analysis that the combination of chemicals used in hydraulic fracturing is based on local conditions. Local conditions are such things as the type of rock formation being fractured and the type and quantity of fluid with which the chemicals are mixed.  The variability of chemical mixtures from site to site results in there being very little in common nationally in the types of chemicals spilled at oil and gas well sites. The chemical formulation of a fracking fluid in Pennsylvania can be completely different from the fracking fluid formula in West Texas or North Dakota.


The state and industry data also showed human error as the cause of the greatest number of spills at well sites, followed closely by equipment failure (such as hoses transporting chemicals) and failure of  containers storing chemicals. Out of approximately 36,000 spills reported in the state and industry data, EPA identified only 457 that were at or near the actual well site being fractured. Of these 457 spills, 151 were a result of chemical mixing operations at the well site. Of the 151 spills, 54 came from storage containers. Sixteen of the spills were actually caused by holes and cracks in the containers. In fact, storage containers were the number one source of spills which reached a drinking water resource. Storage container failures resulted in the most concentrated chemical spills and the largest volume of chemicals spilled, because the chemicals are generally being stored in a concentrated form. Once the chemicals leave storage and are mixed in tanks with fluids (generally water) for use in hydraulic fracturing then they become diluted and the impact of a spill is not as severe. One of the problems with the state and industry data collected by EPA is that there’s little actual information on the exact chemicals spilled at the well sites. There are just general descriptions, such as: oops we spilled some acid or a biocide. There’s better information on the volume of the spills though. The amount of chemicals spilled as a result of the mixing process ranged from 5 to 19,000 gallons.


Of the 457 spills which occurred at an actual well site, 225 were of produced water. Produced water consists of the natural groundwater in the oil and gas formation plus the remnants of the hydraulic fracturing fluid. Once hydraulic fracturing has taken place and pressure is released at the wellhead on the surface, then produced water comes back up the well bore. Usually it is collected in tanks, but obviously there have been spills. Produced water contains only very dilute amounts of the hydraulic fracturing fluid chemicals.


I know what you are thinking. You saw the big number of 36,000 spills. What the heck are all those spills? Sorry it is a bit of a mystery, because the data used by EPA is so bad. Other than the 457 spills mentioned above, EPA couldn’t determine where approximately 12,000 of the spills occurred. On top of that, 24,000 of the spills weren’t at the oil and gas well sites at all.


Did any of the identified 457 spills at the well sites cause contamination? You bet, 101 of the spills contaminated something, mostly soil (97 of the spills). Thirteen spills reached surface water and 9 of the spills contaminated both soil and surface water. There was no reporting on whether groundwater was contaminated because nobody is monitoring groundwater at hydraulic fracturing well sites.


What does this all mean? I don’t know. It’s the reason I called this post the worst I’ve ever written. The weak data on which the report is based makes it hard to say anything about the state of drinking water contamination caused by surface chemical spills at hydraulic fracturing well sites. Obviously there is a big gap in EPA’s analysis. But you know, it is hard to effectively quantify spills from incomplete and inconsistent data.


Probably the most interesting part of EPA’s report on chemical spills at hydraulic fracturing well sites is their analysis of the potential for chemicals used in hydraulic fracturing to migrate into water. Not all chemicals are equal in their ability to move through soils or water. EPA uses a set of chemical properties (for example the ability of the chemical to volatilize into the air and the ability of a chemical to dissolve in water) to determine if the chemical is one that is going to immediately contaminate a drinking water resource or if the chemical is going to hang around all gummed up in the soil and be a source of long term contamination as it slowly leaches drop by drop into groundwater and surface water. Of course nowadays, most spills that contaminate soils get cleaned up right away, so the second scenario involving long term contamination is unlikely in most cases.


Here’s what I thought was interesting about the chemical migration analysis. EPA states that of the 20 most frequently used chemicals in hydraulic fracturing nationwide, the majority are soluble (meaning they readily dissolve in water). The most soluble and mobile in water are methanol, isopropanol and ethylene glycol. There are a few petroleum based organic chemicals in the top 20 most frequently used chemicals in hydraulic fracturing that are not very soluble. But as EPA points out, there are other chemicals used in hydraulic fracturing fluid, like surfactants or alcohols, which can enhance the mobility of organic chemicals including those that are petroleum based. In other words, alcohol carries the organic chemicals along with it in the water. Fortunately chemicals in the environment are not necessarily forever. They are subject to breakdown by bacteria or by chemical transformation. So a chemical like methanol will eventually break down over a period of time to formaldehyde then to formic acid and finally to carbon dioxide.


Anyway, I’m going to say here, EPA’s report is less than a stellar account of the rate and fate of chemical spills at hydraulic fracturing sites. I suppose if you have bad data, you just have to kind of make do with what you have and at least try to say something about it. After all EPA has taken six years to produce a report to Congress. I guess they didn’t want to have to write in the report that their method of analyzing the scope and impact of chemical spills was a total bust. And I suppose regulators and industry can use the information, no matter how small a data set it is, to direct their attention to prevention efforts. Since most of the spills are from containers, they could concentrate attention on conducting inspections of storage areas. But does the report give a national picture of whether chemicals spilled during the hydraulic fracturing process are affecting drinking water resources? No, I don’t think so.

Hydraulic Fracturing Impacts on Drinking Water – Water Acquisition

There are many complaints about hydraulic fracturing, some of them real and some of them imagined. Complaints include everything from too much noise due to trucks and compressors used at hydraulic fracturing sites in the Dallas suburbs, to sudden entry of flammable methane into drinking water wells in Pennsylvania. So the impacts of hydraulic fracturing on the availability of freshwater for other purposes may seem trivial for people dealing with the immediate impacts disturbing their lives. But for some western states, the competition for water in a dry climate can be significant and a cause for concern. After all, there are few surface water resources in arid climates and the surface waters which exist are often fully utilized for domestic drinking water, agriculture and existing industry. People who live in dry climates sometimes rely heavily on groundwater, which is also a limited resource. A new use of groundwater for hydraulic fracturing can potentially impact an aquifer being used by households, farmers, and existing industrial operations.


How much water does a hydraulic fracturing operation need? The U.S Environmental Protection Agency’s Final Report on Impacts from Hydraulic Fracturing Activities on Drinking Water, states the median volume of water used per well is 1.5 million gallons. According to EPA, the average family of four uses about 400 gallons of water for domestic uses a day or 146,000 gallons a year. So hydraulic fracturing an oil and gas well uses about 10 times the amount of water a family uses in a year. Of course the 1.5 million gallons is the median, which means half of the wells being hydraulically fractured used less water and half used more. The amount of water used per well is dependent on the type of rock formation being fractured and whether it is a vertical well or a horizontal well. Fracturing shale requires more water than fracturing sandstone. Oil and gas wells which have been drilled horizontally require more water to fracture the rock than vertical wells.


Where does all this water come from? In the east, it mostly comes from surface water. For example, EPA’s report shows that in Pennsylvania and West Virginia about 90 % of the water used in hydraulic fracturing comes from surface waters like rivers and streams. In the west, the water for hydraulic fracturing comes mostly from groundwater. For example in Texas, 50 to 100 % of water used in hydraulic fracturing is sourced from groundwater. EPA says nationally, only about 5 % of water used in hydraulic fracturing is reused. So basically, the oil and gas business is using almost exclusively fresh water resources for hydraulic fracturing. Nationwide in 2012, the oil and gas industry used 52 billion gallons of water across 20 states to hydraulically fracture their wells. EPA says this is a small number compared to water being used for other purposes, such as drinking water and irrigation. Nationally, less than 1 % of water usage is for hydraulic fracturing.

But in certain areas, especially the dry western states, the percentage of water usage for hydraulic fracturing is greater. Of 401 counties reporting water usage data by the oil and gas industry, there are 26 counties where 10 % or more of the water usage in the county is for hydraulic fracturing.


This is where I have to scratch my head a little bit and wonder why EPA wanted to compare the use of a water resource for hydraulic fracturing against the use of the water for other purposes. In a county with no lack of water resources, the comparison makes no sense as there is abundant water for new uses. In a county with limited water resources, the comparison makes no sense either as there is little water for any use. Most of the counties where the use of freshwater for hydraulic fracturing is large compared to other uses, depend on groundwater. As mentioned above, groundwater is a limited resource. In the arid west, new water entering an aquifer is often less than what is being pumped out of the aquifer for domestic, agricultural and industrial uses. There are many aquifers in the mid-west and west which are being depleted as a result of over pumping of the groundwater. Sometimes fresh groundwater in certain areas of the west is being pumped so much that salty water from other aquifers is beginning to intrude into the freshwater aquifer. As a result, some towns have had to build desalination plants in order to provide people with drinking water.


I suppose the EPA wants to use this comparison to say overall there is little impact nationally on water usage due to hydraulic fracturing. But that only tells part of the story. After all, hauling water long distances adds to the cost of hydraulic fracturing. So water tends to be sourced fairly close to the oil and gas wells. If the source is a nearby stream then taking 1.5 million gallons from it can certainly have some impacts to the local flora and fauna and to people using the water downstream. EPA’s report points this out as a concern in Pennsylvania. Fortunately in that state, there is some government regulation of stream flows to limit impacts from water withdrawals.


Ditto, there is a concern where groundwater resources are limited, like in Texas and North Dakota. Again the water for hydraulic fracturing is sourced locally, usually by drilling a water well nearby. If groundwater is pumped significantly for use in hydraulic fracturing, it may affect the quantity of water available from the aquifer for other uses.  Although this may be happening in only a small number of counties, water managers have expressed concern about the potential impacts to households and farmers using the same groundwater aquifers as those now being utilized as a source of water for hydraulic fracturing. Water managers in a number of counties in Texas and North Dakota are having to make some hard decisions. For example, in North Dakota there was a concern among water managers about the increased pumping of groundwater from the Fox Hills aquifer for use in hydraulic fracturing. They feared that over pumping the aquifer for this new use would end up destroying the artesian flow of the groundwater. Artesian flow means the groundwater rises to the surface (without the aid of an electric pump) as a result of the natural pressure on the aquifer from overlying rock. This is important in rural areas where you don’t have a lot of electric lines to run a pump. In 2012, the state worked with the Corps of Engineers on a study to determine the availability of water for hydraulic fracturing from a reservoir on the nearby Missouri River as a replacement for the groundwater. As a result of the study, the Corps of Engineers determined 32.6 billion gallons of surface water from the reservoir could be made available for the oil and gas industry and for other municipal and industrial uses.


So the issue of impacts to drinking water resources from the acquisition of water by the oil and gas industry for use in hydraulic fracturing is a local one. The use of national water usage numbers is probably not a significant way to express the impacts of hydraulic fracturing on drinking water resources.

Summary of U.S EPA’s Final Report on Impacts from Hydraulic Fracturing

I started reading the recently issued (December 13, 2016) final report from the U.S. Environmental Protection Agency (EPA) – “Hydraulic Fracturing for Oil and Gas: Impacts from the Hydraulic Fracturing Water Cycle on Drinking Water Resources in the United States” (EPA-600-R-16-236Fa). I found the report to be significantly changed from the draft report issued way back in June of 2015. It is less a scientific report now and more of what the document was intended to be – a report to Congress on the impacts of hydraulic fracturing, if any, on drinking water resources. It hasn’t been “dumbed down” for that purpose, as I suppose a member of Congress will never actually read through the report, but it has been made much easier to read with far less science “jargon”. There is also not as much data and discussion on how EPA reached the conclusions in the report. But there is sufficient within the report, which covers a wide range of impacts from water acquisition to chemical toxicity, to dwell on it for some time in a series of posts. Otherwise, today’s post would be about twenty-five pages – a little long for anyone these days to sit down and read.


I will however write you a little summary of the report and you can follow-up in the next few months with my more detailed reviews of individual chapters within the report – the first of which I will post next week. Another reason I want to spread the wealth on the information in this report is because frankly, I have a lot of questions about the data and analysis in the report. I’m going back to many of EPA’s sources cited in the report in order to check the content of those sources so I can better understand the analysis. I was able to attend EPA’s webinar on the report held December 14, 2016. During the webinar EPA explained a few of the discrepancies between the original draft and the final. For example, the report no longer contains the phrase “studies found no widespread contamination of drinking water resources by hydraulic fracturing.” The reason EPA gave for the deletion of this phrase was due to comments from the Science Advisory Board, which reviewed the report, asking EPA to “quantify” this statement. Quantify in this case, apparently means provide exact numbers nationwide on where surface and groundwater have been contaminated during hydraulic fracturing. Since there are no databases containing this type of information, EPA could not reasonably provide such quantification and therefore decided to leave the phrase out of the current report.


Basically EPA said: hey, nobody is out characterizing the drinking water sources in an area before and after hydraulic fracturing occurs, so we can’t really say much about whether hydraulic fracturing is causing widespread drinking water contamination or not. Lack of this type of information is one of the many “data gaps” EPA identified in the report. Since the purpose of the report was to determine if hydraulic fracturing is impacting drinking water sources, I really kind of have to say: huh, are you kidding me, you’ve been conducting this study for six years and all you can say is (I quote here from the final report): “significant data gaps and uncertainties in the available data prevented us from calculating or estimating the national frequency of impacts on drinking water resources from activities in the hydraulic fracturing water cycle. The data gaps and uncertainties described in this report also precluded a full characterization of the severity of impacts.”


I would say there was something seriously wrong with the design of the work plan for the report, if it wasn’t for the fact, EPA didn’t follow the work plan in its entirety. For example, EPA was supposed to conduct pre- and post-hydraulic fracturing characterization of drinking water resources. These studies did not occur, which resulted in the major data gap mentioned above. Other data gaps resulted in part from the databases EPA used. They provided such significant inability for EPA to make conclusions on the nature and extent of any possible contamination; it is now worth while asking: why were they used in the first place.


Well, I better provide a summary now, or this post is going to turn out to be twenty-five pages just by itself. I guess I’ll start where I ended in my last post, when I wrote: “the major findings made by EPA were rather self-evident and didn’t need a six year study.”  Let’s take the first category: water acquisition. Water is a major component of hydraulic fracturing fluid (90 – 97% by volume) so the water used for making up the fluid has to come from somewhere. It can be a lot of water and a major question by water managers in the west has been: how is the increased use of water in hydraulic fracturing activities impacting water supplies. EPA says the median volume of water used per well fractured between 2011 and 2013 (the period of the study) is 1.5 million gallons. Of course you know “median” means half of the wells used more than 1.5 million gallons and the other half used less. It depends on the type of rock being fractured and whether the well is vertical or horizontal as to how much water is needed for hydraulic fracturing. EPA looked at water use by county and was able to determine that in most counties the amount of water used in the hydraulic fracturing of wells was less than 1 % of water use in the county; except in counties where it wasn’t. In fact, in 39 out of 401 counties with data, ten percent or more of water use in the county was for hydraulic fracturing and these were pretty much in the driest states, like Texas and North Dakota, and in counties where there’s not a whole lot of population. States like Pennsylvania in the east, where populations are greater and there is plenty of surface water (of course) showed less water is used by hydraulic fracturing compared to total water uses.


EPA’s study of contamination to drinking water sources from chemical mixing areas (where chemicals are stored on site and transported through pipes and hoses to equipment at the well where fracturing occurs) showed spills to be caused by equipment failure or human error. EPA studied 151 spills at the surface from chemical storage, mixing, and transport. Thirty percent were from the areas where fluid was stored. The median spill was 420 gallons, but the spill ranged from5 galloons to 19,320 gallons and included acids, biocides, friction reducers, cross linkers, gels, and blended fluid. Thirteen of the 151 spills reached a surface water body.


For contamination caused by the actual injection of hydraulic fracturing fluid into a well, EPA looked at a couple of different pathways: those pathways caused by newly created fractures from the process of hydraulic fracturing and pathways caused by mechanical failure or poor construction of the well being hydraulically fractured. These are two underground pathways where the hydraulic fracturing fluid could potentially flow into ground water. EPA pretty much took the information from already published studies; no new findings here.


The concern EPA has with fractures in the subsurface is that they might extend upward from the rock formation being fractured into shallower potable drinking water aquifers and create a route for hydraulic fracturing fluids to move into an aquifer. The EPA cites several studies which show fractures vary significantly in length depending on the rock formation being fractured. For example, hydraulic fracturing creates fractures with a greater median length in the Marcellus Shale of Pennsylvania than it causes in the Barnett Shale of Texas. The orientation of the fractures varies with the rock formation’s depth; fracturing at depths less than 2000 feet yields mostly horizontal fractures which don’t extend upward towards shallower groundwater zones, whereas fracturing at depths greater than 2000 feet yields mostly vertical fractures. EPA cites another study indicating there is a greater likelihood for upward migration of hydraulic fracturing fluid into groundwater resources when there is less vertical separation between the rock being fractured and the rock containing the groundwater.


In the report, EPA has some actual cases they have cited where well construction and mechanical failure causing contamination, but again the number of hydraulically fractured wells where this type of contamination pathway has occurred cannot be quantified


Another pathway EPA looked at to determine its potential for contamination of drinking water sources was the spillage of water containing hydraulic fracture fluid at the surface. When wells are injected with fluid to fracture the rock, high pressures are applied to the well at the surface. After the fractures are formed, the pressure on the well is released and a lot of the fluid put down the hole comes back up to the surface. Normally the water is collected and contained at the surface in tanks. But EPA was able to discern a number of cases (225) from 2011 to 2012 where there were spills of this fluid. Usually spill volumes were small – 340 to 1000 gallons – but there were at least 12 spills greater than 21,000 gallons, one of which was 2.9 million gallons. Thirteen percent of the spills reached surface water.


The collected hydraulic fracture fluid has to be disposed of eventually or reused. Where disposal options are limited, EPA shows more of the fluid is treated and reused. For example, in the past in Pennsylvania the collected fluid was often sent to local Publically Owned Treatment Works (POTWs) for treatment and disposal into local waterways. That all ended of course during the course of EPA’s study. The POTWs couldn’t really treat the fluid sufficiently and water with elevated level of bromide, strontium, barium and radium were being discharged into local rivers. The state environmental regulators pretty much shut all of that down, and now 90 % of the fluid is treated and reused in hydraulic fracturing. Most other states are disposing of the fluid into Class II injection wells. These are permitted wells used for waste disposal. Of course we’ve all seen some of the problems this has caused, not from contamination, but from earthquakes produced by the injection of fluid from thousands of wells into rocks with faults that are activated by all of the excess water. Use of unlined pits for collecting the fluid, instead of containing it in tanks, has also caused contamination as the fluid percolates into shallow groundwater beneath the pits. Many states have outlawed this practice now.


Basically, there’s a lot of information in the EPA report. But other than specific known cases of contamination, EPA is not able to make any sort of conclusion on how widespread contamination is (or isn’t) from the various pathways identified in the report. EPA says in the report, the data gaps are too great to make solid conclusions on the frequency of impacts to drinking water resources from hydraulic fracturing. What they mean by data gap, is simply the information is not readily available; either it is not collected (such as pre- and post fracking water quality), it’s not publically available (the toxicity data on many of the chemicals used in hydraulic fracturing fluid), or the information is just way too difficult to put together (for example, the surface locations of all wells being hydraulically fractured and the locations of the associated wastewater management).


EPA can only make some very obvious conclusions on what can cause impacts to drinking water sources; for example, using a lot of water for hydraulic fracturing in an area with few surface or groundwater sources can impact the availability of water for other uses, or inadequately treated wastewater can impact surface water to which it is being discharged, or disposing of hydraulic fracturing fluid in unlined pits can result in shallow groundwater beneath those pits being contaminated. All of these conclusions are already widely known and only take a modest amount of common sense to figure out. Unfortunately, common sense is not very common and all of these activities have occurred. Will state regulators address these problems with laws and regulations? Many of them already have. But the question remains unanswered of whether or not you need to shiver in your boots, if a company wants to hydraulically fracture an oil or gas well in your neighborhood.

U.S Environmental Protection Agency Issues Final Report on Impacts from Hydraulic Fracturing Activities on Drinking Water

The U.S. Environmental Protection Agency (EPA) issued a final report on December 13, 2016 entitled: “Hydraulic Fracturing for Oil and Gas: Impacts from the Hydraulic Fracturing Water Cycle on Drinking Water Resources in the United States” (EPA-600-R-16-236Fa). The report draws the final conclusions of the multi-year scientific research program conducted by the EPA’s Office of Research and Development to determine what (if any) impacts hydraulic fracturing activities have on drinking water sources.


Today’s press release from EPA states:


Data gaps and uncertainties limited EPA’s ability to fully assess the potential impacts on drinking water resources both locally and nationally. Generally, comprehensive information on the location of activities in the hydraulic fracturing water cycle is lacking, either because it is not collected, not publicly available, or prohibitively difficult to aggregate. In places where we know activities in the hydraulic fracturing water cycle have occurred, data that could be used to characterize hydraulic fracturing-related chemicals in the environment before, during, and after hydraulic fracturing were scarce. Because of these data gaps and uncertainties, as well as others described in the assessment, it was not possible to fully characterize the severity of impacts, nor was it possible to calculate or estimate the national frequency of impacts on drinking water resources from activities in the hydraulic fracturing water cycle.” 


If you are a regular reader of this blog, you will know I have been following the interim scientific reports and support documents released by EPA on the subject. This is a disappointing conclusion after the years of waiting for this final assessment to be completed. EPA does make some conclusions on what hydraulic fracturing activities might contribute to contamination of water. They include the following:

  • Water withdrawals for hydraulic fracturing in times or areas of low water availability, particularly in areas with limited or declining groundwater resources;
  • Spills during the management of hydraulic fracturing fluids and chemicals or produced water that result in large volumes or high concentrations of chemicals reaching groundwater resources;
  • Injection of hydraulic fracturing fluids into wells with inadequate mechanical integrity, allowing gases or liquids to move to groundwater resources;
  • Injection of hydraulic fracturing fluids directly into groundwater resources;
  • Discharge of inadequately treated hydraulic fracturing wastewater to surface water resources; and
  • Disposal or storage of hydraulic fracturing wastewater in unlined pits, resulting in contamination of groundwater resources.

These are what I would call “self-evident” conclusions, which hardly needed years of scientific research to verify. For my readers, I will read through the entire 666 page report and see if I can’t tease anything new to report from it. Look for my analysis is the next few weeks.

An American River in Distress

Trivia question for you. What is the largest American river that does not empty into a sea? I’ll give you a hint. If you look down from the edge of the Grand Canyon, you’ll see this river twisting and winding its way through the scenic gorge it carved out of the mile thick rock layers on which you are standing. Yes, the answer is the Colorado River. Don’t believe me? Check out the photos in this U.S. Geological Survey fact sheet on the 2014 Bureau of Reclamation’s one-time historic release of water from reservoirs on the Colorado River (https://www.usgs.gov/news/a-river-ran-through-it-and-brought-life-least-a-while ), during which water finally reached the Sea of Cortez in Mexico. Water from the Colorado River has only reached the sea a couple of times since the 1960s. Why? Because, the Colorado River is not really a river anymore. It is just a 1450 mile long over engineered water supply ditch.


There are eight major reservoirs on the Colorado River. (Reservoirs are dammed structures that hold water). The Colorado has several famous reservoirs – Lake Mead behind Hoover Dam in Nevada and Lake Powell behind Glen Canyon Dam in Utah. In 2015, the eight reservoirs on the Colorado River were storing 30.2 million acre feet of water. Hydrologists and engineers use “million acre feet” as a way to measure water. An acre foot is around 326,000 gallons or essentially enough water to cover an acre of land with one foot of water. Currently, the reservoirs are at only 51 % of their capacity. Storage capacity for the reservoirs is about 60 million acre feet or somewhere around four years worth of the annual flow of the river. Yes that’s right the average yearly flow of the river over the last 100 years is about 16.4 million acre feet, so more water is being stored in reservoirs than flows down the river in a given year.


The water is released as needed during years when it is very dry and natural flow falls under the average. Forty million people depend on the water from the Colorado River for their water supply and farmers depend on the river’s water for irrigation. And that’s just the United States. There’s a treaty with Mexico that requires the U.S. to provide water to Mexico. So most years between all the users, the natural evaporation, loss of water to vegetation along the river, etc. the entire flow of the river is pretty much used up. Amazing as this may seem, the problem is only getting worse.


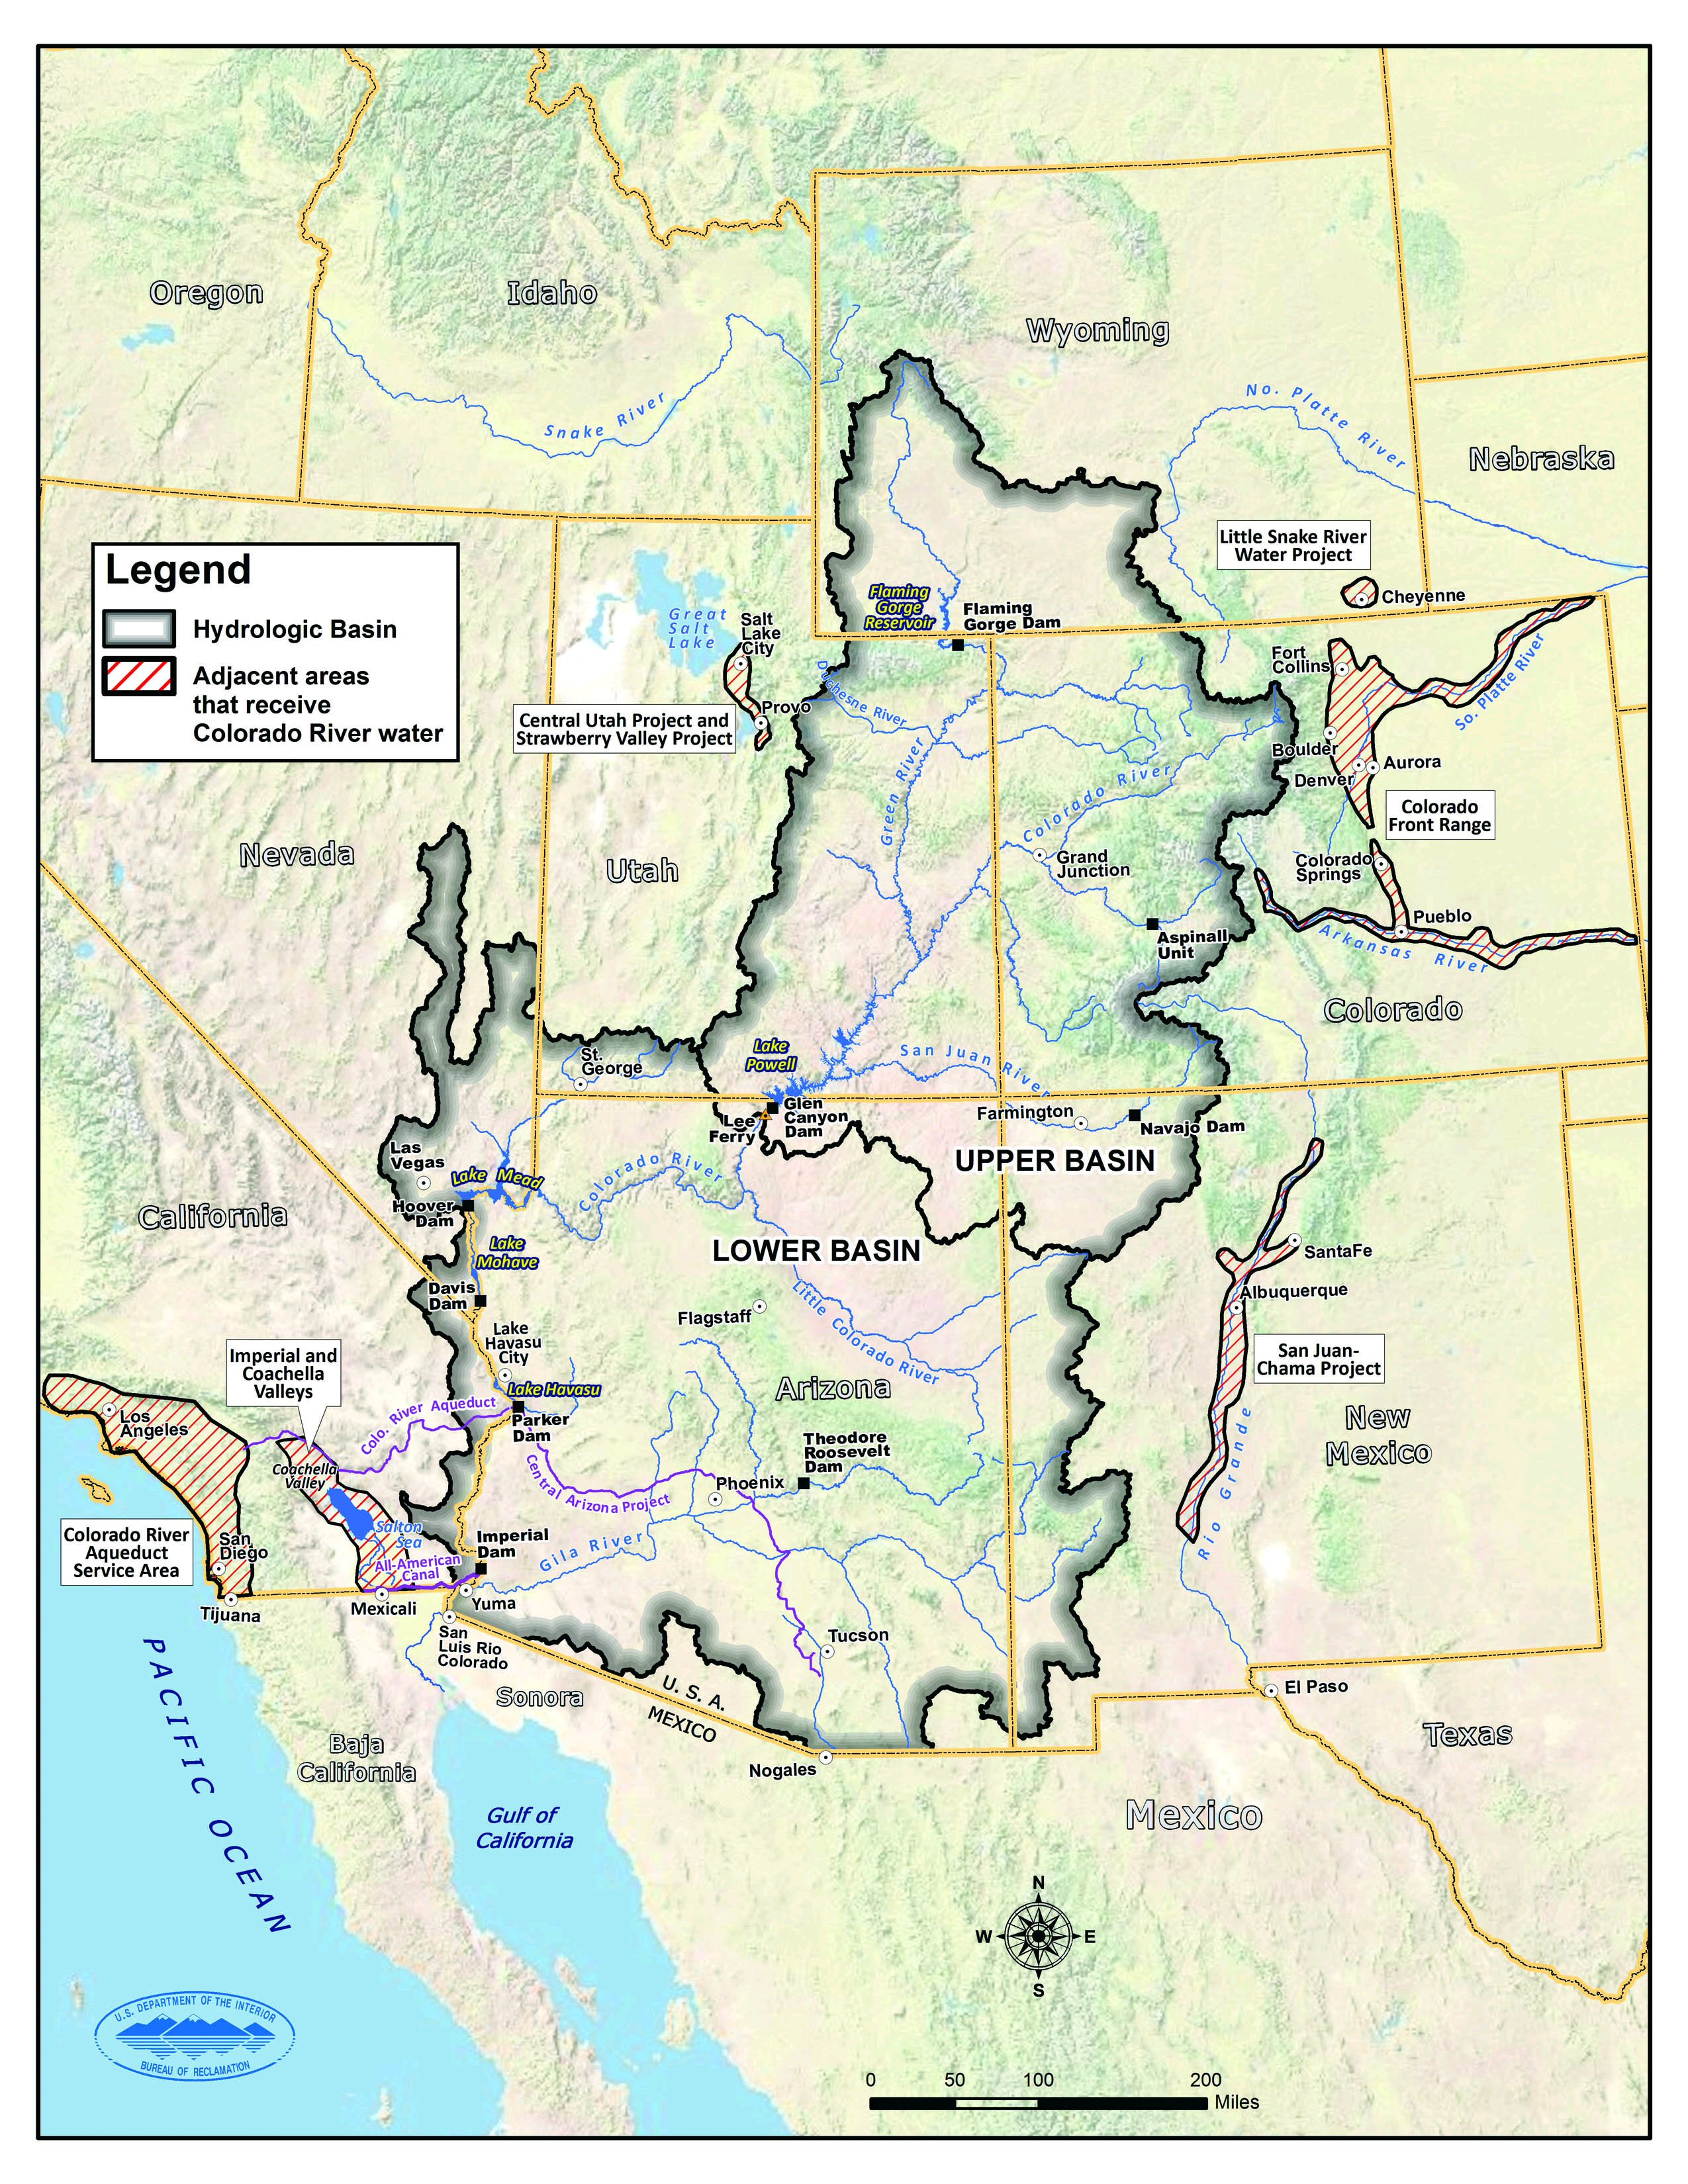
The Colorado River Basin is really big. When hydrologist’s talk about a basin they are talking about an area covered by all the tributaries of a river. This is a map of the Colorado River Basin.

Source: Managing Water in the West Colorado River Basin Water Supply and Demand Study, Bureau of Reclamation, December 2012

As you can see the basin encompasses seven states (Arizona, California, Colorado, New Mexico, Nevada, Utah and Wyoming) which are the driest in the country. Yet four of these states (Arizona, Colorado, Nevada and Utah) are among the top 10 states with the fastest growing population. This is a problem for water managers – a giant problem. They have to maintain water supply for domestic and industrial purposes, for agricultural irrigation and livestock watering, and for in-stream water flows to support wildlife and fish.


A federal agency – the Bureau of Reclamation – and the 7 Colorado Basin states manage the river’s water supply together. There has been a lot of head scratching by this group about the future water supply from the Colorado River. In fact, in 2012, the Bureau of Reclamation issued a report entitled: “Managing Water in the West: Colorado River Basin Water Supply and Demand Study.” The study looked at the future potential water flow in the river and the demands for that water all the way to the year 2060. I don’t usually cover engineering studies like the Bureau of Reclamation report in this blog, but the study is of interest because it seeks to inform decision-makers of the extent of future water supply deficiencies and options available to alleviate the deficiencies.


All sorts of decisions have been made in the past without studies. Case in point, in 1922 Herbert Hoover as Secretary of Commerce began the first in a series of decisions that would eventually make the Colorado River nothing more than a glorified pipeline for water supply eventually depriving the Sea of Cortez of a major source of fresh water flow. Hoover’s decision legally divided the Colorado River into Upper and Lower Basins using the point of Lee’s Ferry in Arizona as the demarcation line. All areas draining into the Colorado River above Lee’s Ferry are considered the Upper Basin, which includes Colorado and Wyoming and parts of Arizona, New Mexico, and Utah. The Lower Basin includes the areas draining into the Colorado River below Lee’s Ferry, encompassing the other parts of Arizona, New Mexico, Utah, and the entirety of Nevada and California. Hoover’s decision essentially gave 7.5 million acre feet of Colorado River water to each of the basins to be allocated by the states. Allocated means given a right to use the water. Ten other decisions from the 1920’s to the 1970’s form what is euphemistically called the “Law of the River” making the Colorado River one of the most regulated and controlled water bodies on the face of the earth with the sole purpose of providing water supply.


The 2012 Bureau of Reclamation study predicted possible future water supply from the Colorado River by looking at trends in the variability of the flow in the river. It looked at the historical record over the last hundred years, which is based on actual real life measurements of water flow and it looked at paleontological types of records, like tree rings, to estimate flow before measurements were kept. I think everyone knows that when you cut a tree, you see a cross section of rings. These rings can be wide or narrow depending on how much a tree grew in a particular season. If they are narrow, it indicates a dry season and the tree didn’t have much growth. A wide ring indicates a rainy period where the tree grew a lot. There are about a dozen other ways, besides tree rings, scientists use to reconstruct climate conditions. For example, scientists use ice cores from glaciers to determine rain and snowfall amounts and they use soil cores to determine the distribution of pollen and dust. This is all common sense stuff the average reader knows, when there’s more precipitation then glaciers grow, when there’s more rain then trees put out more flowers and pollen, when its dry then more dust and dirt blows around. So scientists can reconstruct the climate based on these paleontological types of data and show what the trends in stream flows were in the past. Such reconstructions are called paleo-reconstructed models of climate. The Bureau of Reclamation study developed a projected stream flow record for the Colorado River from a paleo-reconstructed model. For a third type of future water flow projection for the Colorado River, the study combined the trends based on paleo-reconstructed data with the trends based on measurements from the last hundred years. They described this projection as a paleo-conditioned scenario.


Very interestingly, the paleo-reconstructions of stream flow showed a great variability over the last 1250 years. In fact during the period between 762 and 2005 there were some hugely long dry periods of up to 16 years where stream flows were reduced beyond anything seen in recent times. Over the last 100 years there has been a general decline in stream flow. There has also been a major seasonal “shift” of when the most runoff enters the Colorado River. This shift is due to a decrease in the amount of spring snowmelt.


Projections of future water supply in 2060 from the river based on the various paleo-reconstructed models showed mean water flows of 14.7 to 15.0 million acre feet, similar to the current observed mean of 15.0 million acre feet. The study also made some projections based on the general circulation models for climate. These models are developed by the International Program on Climate Change sponsored by the United Nations. These projections were not good. Projected mean flows were around 13.7 million acre feet if temperature increases of between 1.3 and 2.4 degrees Centigrade occur – a decrease of 8.7 % from the current observed mean.


The real problem is not necessarily the amount of water available though, it is the projected future demand for water in the area. The study looked at possible future uses in the Colorado River Basin – population growth, agricultural growth, tribal water right settlements, increased energy production – and also looked at possible  increases in future efficiency in water use. You know what efficient water use is – landscaping without grass and other water hungry plants, recycled water like you see at car washes now, low flow toilets, etc. Based on a number of variations in these different factors (for example normal population growth versus rapid population growth) the projected additional water in million acre feet needed from the amount used in the Basin area today ranged from 1 % to 3 %. But we’re talking total water use here, not just the water supply from the Colorado River. Some of those increases are going to come from other sources, mostly in Colorado and California.


Expected increased needs from the Colorado River are due mostly to increased population and industrial growth. The study anticipates municipal and industrial demands from the river will grow from the 3.4 – 3.5 million acre feet today to 4.5 – 6.2 million acre feet by 2060. The study projects another 3.2 million acre feet of water above the river’s projected mean annual flow will be needed by 2060. This is what water supply managers call an imbalance. There have been occasional imbalances of this magnitude in the past, but as you’ve learned, the reservoirs made up the deficiency. A prolonged imbalance will mean less water available to store in those reservoirs. The future doesn’t look bright for maintaining water supply in the Colorado River Basin without some big changes either in development of new water sources, like desalination of ocean water and importing water from other rivers in the U.S. through pipelines and via ocean going tankers, or massive water conservation and watershed management projects. In the end, the Colorado River becomes even less of a river and more of just a conduit for water supply. How far upstream will the trickle come to a stop?


EPA Issues Review of Well Operator Files: Hydraulic Fracturing Operations

On August 1, 2016, EPA issued the final research report: Review of Well Operator Files: Hydraulic Fracturing Operations (EPA/601/R14/004, July 2016). This new report examines the records of nine companies conducting hydraulic fracturing at 23,200 oil and gas wells between September 2009 and September 2010. Interestingly some of these oil and gas wells were hydraulically fractured more than once during that time span, so there were actually 28,500 occurrences of hydraulic fracturing over the one year period that EPA examined. EPA calls these occurrences: hydraulic fracturing jobs.


To understand the report, one must know a little bit about how oil and gas wells are constructed. After a well is drilled, a metal pipe called a casing is set into the hole created by the drill. Usually the space between the outside of the casing and the rock is filled with cement. The space between the casing and the rock is called the annular space. The annular space can be cemented for the entire length of the well or it can be cemented just in certain sections. Cement helps to protect groundwater by preventing fluids from moving up the annular space and into rocks containing protected groundwater resources. Cementing is also used to prevent gas and other fluids from moving up the annular space and causing a ruckus at the surface. Sometimes a device known as a packer is also used to seal off sections of rock containing groundwater. Packers are mechanical devises which look a lot like plungers. Before wells are hydraulically fractured, the casing next to the rock formation containing the oil and gas is perforated so the pressurized water and chemicals can enter the rock at great force and produce fractures. Occasionally however, what are called “temporary casing strings” are used for the hydraulic fracturing process instead of the permanent cemented casing. These casings really are temporary and are removed after the process is completed.


Of the hydraulic fracturing jobs EPA examined, 90 % had cemented casing, 5 % had packers, and 5 % had open holes. In 10 % of the jobs temporary casing strings were used. Temporary casing strings were used both with the open holes and in some wells with permanent cemented casings. Generally when a temporary casing string was used in an oil and gas well with a cemented permanent casing, the wells were undergoing recompletions or refractures. Recompletions are where an existing well which was previously hydrofractured at one depth is later refractured at another depth. Refractures are where the same depth in the well is being refractured. Recompletions and refractures are most often done in older wells (EPA gives a median age of 6 years for the wells examined in their report.)


This is all important knowledge, because how wells performed during hydraulic fracturing is dependent on the integrity of the safeguards like concrete, casing and packers put into place to prevent movement of fluid into protected groundwater zones. EPA calls the success of these safeguards – “mechanical integrity.” To determine the mechanical integrity of the 23,200 wells, EPA examined four different tests conducted by companies during the hydraulic fracturing process. The first type of test is a casing pressure test. This kind of test is conducted before the well is hydraulically fractured and is used to determine the mechanical integrity of the well. Basically pressures to be used in the hydraulic fracture process are applied to the well. If the well maintains its integrity then there should be no mechanical failure of the safeguards protecting groundwater during the actual hydraulic fracturing.


The second type of test is surface treating pressure monitoring. This is simply the monitoring of the pressure being applied to the well during hydraulic fracturing. If there is a sudden drop in surface treating pressure during hydraulic fracturing, it is likely one or more of the safeguards have failed.


The third test is annular pressure monitoring, which is simply the monitoring of pressure in the annular space during hydraulic fracturing. Changes in the pressure in the annular space should tell you if the wells safeguards have been breached.


And the fourth test is microsesimic monitoring, where monitors are set out to determine the extent of fracture growth in the subsurface. Microseismic monitoring can tell you if vertical fractures are long enough to intersect groundwater zones above the hydraulically fractured rock area.


As you can imagine, it was kind of hit or miss as to what sort of testing had been conducted at the wells. Two or more tests were conducted at 76 % of the 28,500 hydraulic fracturing jobs EPA examined. Casing pressure tests were conducted at 57 % of jobs, surface treating pressure monitoring at 97 %, annular pressure monitoring at 53 %, and microseismic at 0.5 %. So other than measuring surface treating pressure during the actual hydraulic fracturing process, there is simply not a lot of data being collected. In fact the annular pressure tests were so frequently insufficient; EPA opted not to even use the data for analysis. So we’re down to 3 tests now and one of them, the microseismic test, has very little data.


EPA relied mostly on the other two tests (casing pressure and surface treating pressure) and notes taken by companies kept during the hydrofracturing process to determine mechanical integrity of wells that had been hydraulically fractured. Reported in company notes were failure of the mechanical integrity of the well in 3 % of all the hydraulic fracturing jobs. Failures occurred in new wells (2%) and in recompletions and refractures (6%). EPA found that jobs using temporary casing strings had the largest number of failures. In fact 20 % of the jobs using temporary casing strings had some sort of failure. Failure generally meaning one or more of the safeguards failed. Now many wells of course don’t have just one casing, sometimes there are multiple casings set in the well, so failure doesn’t mean fracturing fluid escaped into a groundwater zone. In fact, EPA noted in their report that once failure was noted by a company, the job was stopped and the cause of the safeguard failure was addressed. But in 0.5 % of the hydraulic fracturing jobs, information in the companies’ files indicated fracturing fluid moved into the annular space at the location of groundwater.


EPA did learn something from the microseismic monitoring they examined. Among the 100 jobs where it was done, EPA used the data to estimate the vertical extent of fractures. It showed vertical fractures grew anywhere from 380 to 1340 feet. EPA could find no case where vertical fractures extended into the groundwater zone in the areas being hydraulically fractured. In fact EPA estimated fractures reached no closer than 5000 feet from any groundwater source.


What did EPA learn from the casing pressure tests and surface treating pressure monitoring?  In 48 % of the hydraulic fracturing jobs where casing pressure tests were conducted, the pressures recorded during the actual hydraulic fracturing process exceeded the casing pressure tests by 1000 to 1999 pounds per square inch.


Pretty interesting information. The most interesting fact to me is there were 142 hydraulic fracturing jobs out of the 28,500 jobs examined, where the mechanical safeguards in the well failed and hydraulic fracturing fluid entered groundwater zones. Is a 0.5 % failure rate of wells during hydraulic fracturing an acceptable failure rate? This will have to be determined by state governments who oversee oil and gas operations in their states and the citizens who live in the vicinity of oil and gas fields.


On August 11, 2016, the Environmental Protection Agency’s (EPA) Science Advisory Board issued their Peer Review of the EPA Draft Report on Impacts of Hydraulic Fracturing on Drinking Water. The peer review contains the Science Advisory Boards’ official comments on the EPA Draft Report. EPA announced it will use the Science Advisory Boards’ final peer review comments, other scientific literature completed since the release of the EPA draft, and public comments to complete their final report within the next few months.

Selenium in the Water Environment

For those of you who enjoyed my previous blog posts on selenium, here’s a little lagniappe for you on the behavior of selenium in the aquatic environment.  As I mentioned in an earlier post, selenium acts a lot like sulfur in that it combines with other elements and organic matter to form different species. (For an explanation of elemental species, here is a link to another post https://waterblogger.org/contaminants/the-mercury-cycle/). In surface waters with a lot of oxygen, you’ll most often find two mineral species called selenite and selanate, which are the result of the combination of selenium with oxygen. Algae and other floating microorganisms in the water are sucking up this stuff, turning it into organic forms of selenium and accumulating it within their teeny weenie little organic structures.


Down below the water, you’ll find a lot going on in the dynamic chemical environment of sediment. There’s lots of organic material in sediment with which selenium can combine to form organic selenium species. There are also lots of other elements like iron with which selenium species react. And there are all sorts of microorganisms tooling around looking for a snack. Under these varying conditions of chemical and biochemical activity, selenium is being converted from one selenium species to another.


For example, all those microorganisms chowing down on the selenium in sediment frequently methylate it, which forms organic selenium species. (Read the post at the above link, to find out what methylation is). Organic selenium species get processed right into the living structures of the tissues of animals like fish. According to the great compendium of the Toxicological Profile for Selenium published by the Agency for Toxic Substance and Disease Registry (ATSDR), these organic selenium species are similar to the organic sulfur ones used by living organisms in the production of amino acids. In fact, ATSDR says selenium substitutes for sulfur in amino acids. The names for these amino acids are selenocysteine and selenomethionine. Do you remember what amino acids are? They are the building blocks of protein. Protein supports the growth of tissue, muscles, and bones. Neither fish nor we could get along without protein.


So those are the mechanisms by which selenium in the aquatic environment enters the food chain. Basically all the little guys like algae and microorganisms that feed on selenium in the water and the sediment are eaten right up by insect larvae, larval fish, clams and mussels, and similar denizens of the aquatic world, which in turn are then eaten up by fish and birds. Voila, a perfect web for selenium poisoning.