The author has 35 years of environmental experience primarily with oil and gas and mining development, abandoned mines, and water issues in the private and public sector. A colleague once described the author as being a member of every weird water group in the West. A former Department of the Interior employee, the author received the Department's highest award for Distinguished Service in 2015.
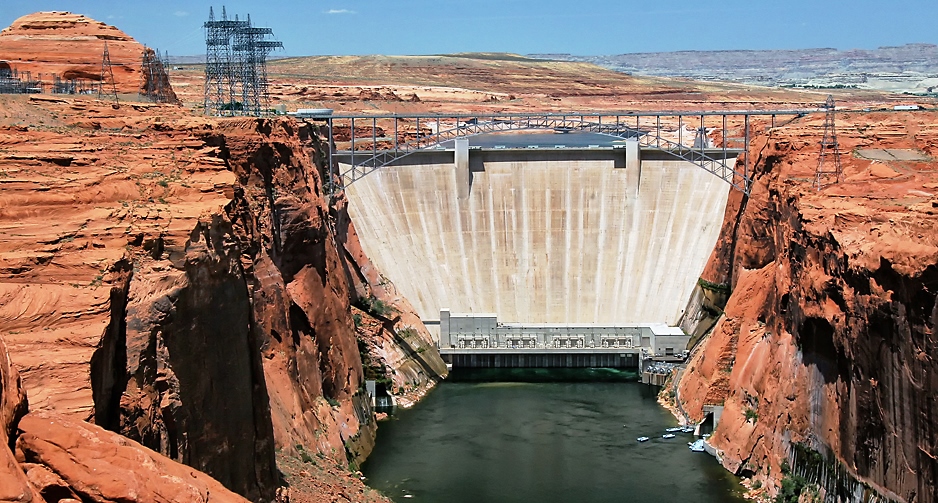
Glen Canyon Dam on Lake Powell in Page Arizona from Bureau of Reclamation files
The U.S. Bureau of Reclamation just issued a Record of Decision on hydrologic management of the Colorado River. It establishes a framework for operation of Lake Powell and Lake Mead. The framework is outlined in the Bureau’s Post-2026 Operational Guidelines and Strategies for Lake Powell and Lake Mead https://www.usbr.gov/ColoradoRiverBasin/post2026/final-eis/index.html. This document will replace the expiring Colorado River management agreements at the end of 2026.
Reclamation was hoping that the seven states which the Colorado River runs through and who are the primary users of the water from the river would come together and produce their own consensus-based agreement but of course that never happened, so the Bureau stepped in to make sure there was something to replace the existing agreements. The Bureau of Reclamation operates the dams on Lake Powell and Lake Mead so that is their main focus. There has to be enough water in the lakes to operate the dams. Period.
The west has been in drought conditions for years now and water levels in the lakes and in the whole reservoir system that the Bureau operates are dangerously low. Yet the lower basin states (California, Arizona, and Nevada) go blissfully on like nothing is happening. Out of control growth and overpopulation. It’s no wonder that the upper basin states of Wyoming, Utah, Colorado and New Mexico can’t make an agreement with these water hogs. Wallace Stegner the great American author wrote a book called Beyond the Hundredth Meridian that tells the tale of the whole development of western water management policy in the United States. It’s the story of John Wesley Powell whose first navigation of the whole of the Colorado River is legendary. Few people know though that Powell was the one who pushed for the western water management system that we have now. He told the idiots in Washington that there wasn’t enough water beyond the 100th meridian to support future western expansion and the idiots basically said, “so fix it.”
Now after years of drought and changes in climate conditions the truth of it all is apparent. It cannot be fixed. Even the new “operational guidelines and strategies” is admitting this because it relies on adaptive management practices. If you haven’t heard this term before, it means “an iterative method of decision making in the face of uncertainty.” Previously known quantities of water were scheduled for release on a yearly basis so water managers in states could plan. No longer. Now The ROD establishes operating guidelines through 2036 that will be determined in 2-year increments. What you get in 2027 may not be what you’re going to get in 2029, unless a broader consensus among the Colorado Basin States supports a longer duration (I’m personally not waiting for that to happen).
From what I can tell, 2027 will start with a range of possible releases of water from Lake Powell to the downstream Lower Basin States of 5.0 million acre-feet (maf) to 12.0 maf. This entails shortages for the Lower Basin of up to 3.0 maf. The Bureau plans water storage in Lake Powell of up to 8.0 maf and 3.0 maf in Lake Mead. The Bureau also is planning for voluntary Upper Basin conservation of up to 200,000 acre-feet (good luck with that).
I wrote a blog post many years ago about the poor old Colorado River and the stress that it was undergoing. You can read that post by clicking here An American River in Distress . I have been writing a lot about Water Bankruptcy recently. The definition of water bankruptcy is “the critical condition in which water resources are depleted or so severely mismanaged that they can no longer meet the essential needs of populations, ecosystems, and economies”. To read my post on Water Bankruptcy click on this link Is the World Really in Global Water Bankruptcy? . Is the Colorado River in Water Bankruptcy? This is a very good question. I’m going to attempt to answer that question in the next few months by looking at the recent hydrologic studies of the river. So as they say in the biz: “Stay tuned.”
After my last post on whether the Floridian Aquifer in Florida was in water bankruptcy (according to the definition from the United Nations University Report entitled Global Water Bankruptcy) I was contacted by a reader of this blog from Georgia. He gets his water from a small municipal system supplied by wells into the Floridian aquifer. I explained in my first post on the Floridian: An Aquifer is All About Its’ Geology that the Floridian aquifer extends into southern Georgia, South Carolina and Alabama. The situation in Georgia where my reader lives is quite a bit different from Florida. Let’s take a look and see if the Floridian in Georgia could be classified as being in water bankruptcy.
As usual when discussing an aquifer we’ll start with the geology. The Georgia and South Carolina parts of the Floridan aquifer are at the northern most edge of the broad carbonate platform that underlies much of Florida and the adjacent Coastal Plain. The Eocene and Oligocene limestone and dolostone formations of the Floridian dip and thicken towards the coast with more purely limestone and dolostones of Eocene and Oligocene age. The main formations are the Ocala limestone and the Suwannee Limestone which were deposited in shallow marine environments as lime muds, skeletal debris and reef and shoal deposits. After burial and consolidation, the carbonates were altered by recrystallization and through carbonate dissolving along fractures – similar to the Floridian’s formations in Florida. Up dip, toward the Fall Line where coastal sediments meet the metamorphic and igneous rocks of the Piedmont the carbonate formations become thinner, more discontinuous, and increasingly mixed with siliciclastic sediments.
The aquifer is overlain by younger rock formations comprised of clay, silt, sand, phosphates, and unconsolidated surface deposits of Miocene, Pliocene, Pleistocene, and Holocene age that serve to confine the aquifer and restrict surface recharge. The formations of the Floridian in Georgia are recharged where they outcrop at the surface near the Fall Line. This is very different from Florida where formations of the Floridian outcrop over much of the surface of the state and water recharge to the aquifer is direct. Because of this indirect recharge, water that enters the Floridian aquifer near the Fall Line takes thousands of years to reach the coast. I hope people who use the water along the coastal plain think about that when they leave the tap running.
Just as in Florida, the aquifer is divided into the Upper and Lower Floridian. Intervening between the carbonate formations comprising the Upper and Lower aquifer are marls and siliclastic rocks; however, they are not continuous throughout Georgia and sometimes the Upper and Lower Floridian are connected. And just like Florida, the Upper Floridian is the more prolific of the two with much better water quality, although still “hard”, containing high levels of calcium and magnesium.
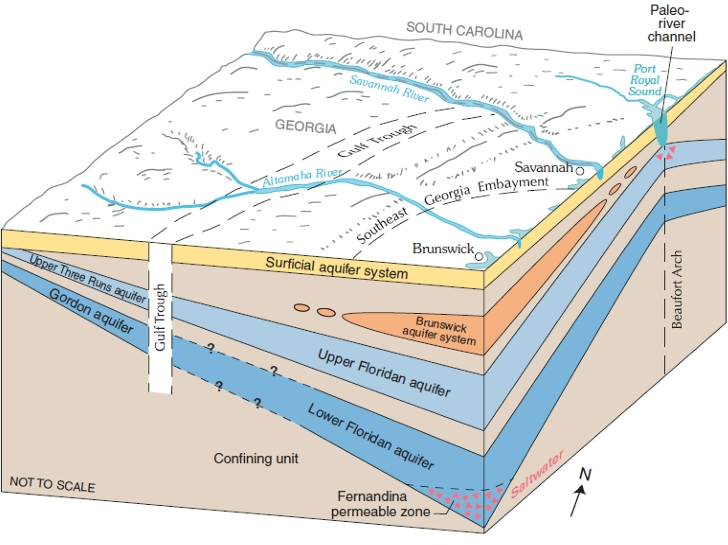
The Upper Floridian has been a traditional source of water in Georgia for municipal, agricultural and industrial needs. Unfortunately, that all had to change. The reason: saltwater intrusion. I discussed saltwater intrusion in my blog on the Floridian aquifer in Florida. You can read it here ( IS THE FLORIDAN AQUIFER SUFFERING WATER BANKRUPTCY? ). In short, the formations of an aquifer do not stop at lands end. No, they continue on beneath the ocean. In Georgia it is fortunate that the formations of the Floridian are overlain in most places by fairly thick overlying rocks, so saltwater from the ocean does not intrude into the aquifer. Not so in South Carolina. Hilton Head is the offending area. The local absence and erosion of these overlying rock formations have resulted in saltwater intrusion.
As you can see from the figure above taken from the Georgia Environmental Protection Division website, the area called the Beaufort Arch is where the problem exits. In the past when sea level in the Hilton Head area, including the Calibogue Sound west of the island, was lower ancient rivers cut right through the overlying rocks and formed channels. Later these channels filled with younger porous sediments. These channels can act as conduits for seawater to move downward into the Upper Floridian aquifer.
This might not sound like all that much of a problem, but because the Floridian aquifer was so overused on the southern coastal plain in Georgia it resulted in water in the aquifer moving from South Carolina towards the centers of pumping in Georgia. All sorts of towns and municipalities in Georgia, including Savannah and Brunswick, used the Upper Floridian aquifer as their main source of water. Before this large-scale groundwater development, freshwater in the Upper Floridan aquifer moved generally from inland recharge areas in South Carolina toward the coast and discharged upward or seaward. Under those natural conditions, artesian pressure helped keep saline water offshore or beneath the freshwater system. Hilton Head had increased vulnerability because the island lies close to Port Royal Sound, Calibogue Sound, and other saline surface-water bodies that overlie or border parts of the Floridan aquifer system there. It’s not all Georgia’s fault though, after all Hilton Head Island also was withdrawing water from the Upper Floridian which lowered the water table and reversed the aquifer’s natural seaward hydraulic movement. United States Geological Survey studies of Hilton Head have clearly shown how declining aquifer pressure changed the groundwater flow direction beneath the island. Instead of freshwater consistently moving toward Port Royal Sound, portions of the aquifer began moving landward.
To add insult to injury for the Floridian aquifer in Georgia, over pumping in the Brunswick area has caused another type of saltwater intrusion. The Upper and Lower Floridian aquifers are more integrated in that area because of faulting and fracturing in the rock formations. The Lower Floridian is not of high quality. Due to over pumping this low-quality saline water was drawn upward into the Upper Floridian aquifer. The problem is most significant in downtown Brunswick.
During the 1980s efforts began in Georgia to prevent saline waters from destroying the Floridian aquifer. Georgia began limiting water withdrawals from the aquifer in the most vulnerable coastal areas, especially around Savannah. The major turning point came in 1997, when the Georgia Environmental Protection Division adopted the Interim Strategy for Managing Salt-water Intrusion in the Upper Floridan Aquifer of Southeast Georgia. The strategy covered twenty-four coastal counties and imposed caps or reductions in areas where additional pumping could worsen saltwater movement. It required areas around Savannah to reduce groundwater use by at least 10 million gallons per day by the end of 2005 and limited new withdrawals in other parts of the coastal area.
Georgia replaced the interim strategy with the Coastal Georgia Water and Wastewater Permitting Plan for Managing Saltwater Intrusion in 2006. The plan instituted a more detailed management system for the Floridian aquifer. In the Savannah area where saltwater encroachment from the Hilton Head side was a central concern, the plan continued to limit Upper Floridan withdrawals and encouraged the shift to alternative sources, including surface water. Savannah now gets its’ water from the Savannah River. Smaller communities with no access to surface water have very restrictive limits on withdrawal and major water conservation measures are in place. In Brunswick where the saltwater plume was already wreaking havoc on water-quality, the plan preserved withdrawal restrictions. Brunswick has responded with conservation measures and drilling wells into less productive aquifers to supplement their water supply. And Hilton Head? Well, they have chosen to drill a very deep well into Eocene rocks. It’s poor water quality but they have added a desalination plant using reverse osmosis to treat it.
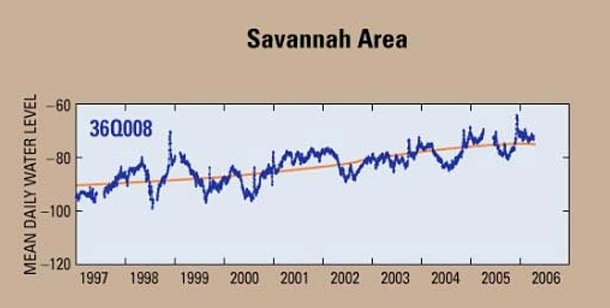
Is the Floridian in Georgia in water bankruptcy. I say no. Good management practices early on have disrupted such a catastrophe. This hydrograph from the USGS shows the rebound of water levels in Coastal Georgia after the institution of Georgia’s aquifer control measures.
But the Floridian around Hilton Head in South Carolina might well meet the definition of water bankruptcy as once salinization occurs you’ve wrecked your water supply permanently.
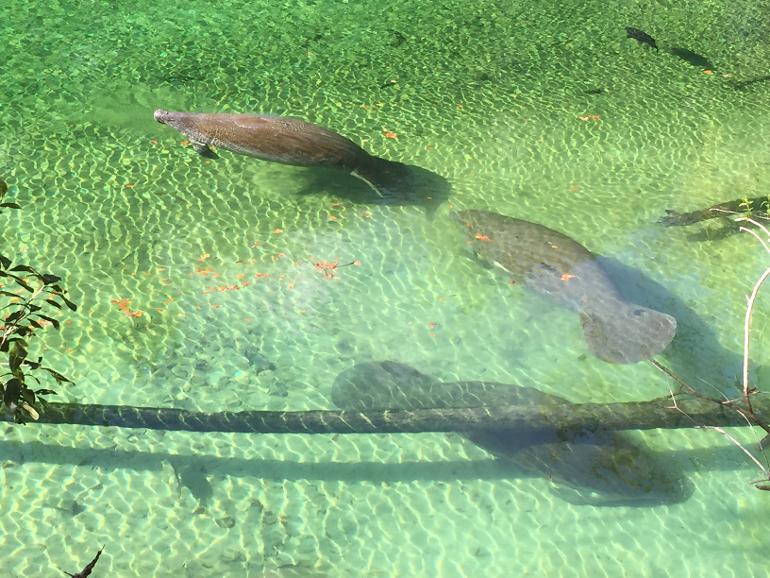
Manatees enjoying a spring fed by the Upper Floridian aquifer
The 2026 United Nations University Report Global Water Bankruptcy frightened a great many people by declaring much of the world is currently in water bankruptcy – the state of water resources being so overused and degraded that they cannot be restored to their original condition and function. It caused me to contemplate how much of our water resources in the United States are in this state of collapse. Might as well start with our most prolific, so I took a look at the Floridian aquifer in Florida. It is probably the country’s greatest aquifer and supports human consumption, agricultural irrigation, and industrial needs.
The Floridian aquifer underlies Florida, the southern parts of Georgia into coastal South Carolina, and parts of southern Alabama. It is a limestone aquifer and if you want to know something of its geology in Florida you can check out my blog post here ( The Floridian: An Aquifer is All About its Geology )The geology of an aquifer is important as it will tell you about flow, chemistry and a host of other important parameters. The Floridian aquifer through most of its’ extent is divided into an Upper Floridian aquifer and a Lower Floridian aquifer. The Upper aquifer is the good one which everyone likes to tap as the water quality is generally excellent and recharge from the surface and through karst features produces tons of flow. The Lower aquifer is confined in most areas by overlying thick formations of marls and siliclastics that restrict water flow into It from above. The water quality is also not very good and it is pretty deep, so drilling into it is costly for well development My attention then is solely on the Upper Floridian as to whether it is overused and degraded to the point where Floridians are going to be in trouble with water supply in the future.
The two major issues that could affect this mighty aquifer are karstification and salinization. Let’s look at the condition of karstification first. Karstification problems are most often caused by overuse. In other words, too much water in a concentrated area is being pumped out of the aquifer. Over pumping leads to increased solutioning of the limestone. Fractures, vugs and caverns all increase in size. In addition, over pumping causes the groundwater table to lower which can lead to collapse of the limestone formation. These collapsed areas are called sinkholes. Every once in a while you will see one on tv where a sinkhole has swallowed a house or road.
Most large cities in Florida have groundwater well fields where a number of wells have been drilled into the Upper Floridian. When water is pumped from these well fields it produces what is known as drawdown. Water rushes into the screen of the wells and is pumped up to be stored above ground. As the water is pumped from near the well, water further from the well is drawn toward it. A cone of depression around the well is formed. The more the well is pumped the greater the cone of depression becomes. The water table will begin to lower, and the limestone once supported at the surface by the water begins to collapse.
One of the classic examples of well-field-related sinkhole problems comes from the municipal well fields north of Tampa. The U.S. Geological Survey documented that this Gulf Coastal Plain area was already densely pitted with natural sinkholes and sinkhole lakes, and yet water authorities continued over pumping from the municipal well fields causing abrupt drops in groundwater levels. The surface began to collapse. Eventually many of the wells in the field were abandoned and to prevent further collapse pumping levels were curtailed. Alternative sources of water had to be added including river water, stored reservoir water and desalinated seawater to restore water supply to the city.
Salinization of the Upper Floridian is the other big threat to the aquifer. Salinization is the fancy scientific name when saltwater either from the ocean or from lower saline aquifers begins to intrude into a freshwater aquifer like the Upper Floridian. I’m always saying that every drop of water connects to every other drop of water on Earth, so salinization in coastal areas is quite common. The ocean and nearshore aquifers interact. If there is tidal flooding or a drought then salt water from the ocean can intrude substantially into a fresh water aquifer.
But by far the greatest cause of saltwater intrusion into the Upper Floridian is once again over pumping. When water is withdrawn faster than it can be replenished, the pressure differential allows saltwater to migrate inland. This phenomenon is particularly pronounced in highly populated areas and agricultural areas undergoing extensive irrigation.
Saltwater intrusion compromises the quality of drinking water by increasing salinity levels. Elevated salt concentrations pose health risks and can render groundwater unsuitable for consumption without costly treatment. Using saline water in agricultural operations can damage crops sensitive to salinity and in the long term result in salinization of soils rendering them infertile as nothing will be able to grow there.
Miami-Dade, Broward, and Palm Beach counties in south Florida are among the most severely impacted by saline intrusion. Dense urban development, high water demand, and proximity to the coast have accelerated salinization of the Upper Floridian aquifer. In southwest Florida the cities of Naples and Fort Myers face salinization of both potable water supplies and agricultural irrigation wells. In Miami-Dade County, saltwater intrusion has led to the closure of several municipal wellfields and the construction of inland wells. Similarly, in Tampa Bay, increased salinity in groundwater has necessitated investment in desalination facilities.
Unfortunately once saline water intrudes into an area, it can’t be reversed. Prevention is the only management strategy available. The state of Florida’s Environmental Protection Division and its’ five water management districts have teamed up with the U.S Geological Survey to put a prevention plan in place. A major component of their plan is to set Salt Water Intrusion Minimum Aquifer Levels, often called SWIMALs, for vulnerable areas of the Upper Floridan aquifer. These levels are designed to maintain enough freshwater pressure in the aquifer to slow or prevent regional saltwater movement. Another part of the state’s response is reducing dependence on fresh groundwater. The Florida Department of Environmental Protection recognizes that groundwater withdrawals cannot continue to grow indefinitely without unacceptable impacts, including saltwater intrusion, reduced spring flows, lower lake levels, and wetland losses. As a result, the state promotes alternative water supplies such as reclaimed water, brackish groundwater, seawater desalination, stormwater, surface water, conservation projects, and aquifer storage and recovery. Florida is also experimenting with aquifer recharge projects that can help slow saltwater intrusion by increasing freshwater pressure in the aquifer. Hillsborough County provides a practical example. Working with the Southwest Florida Water Management District and the Florida Department of Environmental Protection, the county has developed coastal recharge projects that inject highly treated reclaimed water into a non-drinking-water portion of the aquifer near the coast. The goal is to create a freshwater barrier between saltwater beneath Tampa Bay and the freshwater inland, while also supporting higher groundwater levels upstream of the recharge area.
So having examined the facts about damage to the Floridian aquifer in Florida can we say that the aquifer is in water bankruptcy. I think not. Salinization is localized and management strategies are in place. The Floridian aquifer will continue throughout most of its extent to be a prolific water resource.
Is The Floridian Aquifer in Florida in Water Bankruptcy?
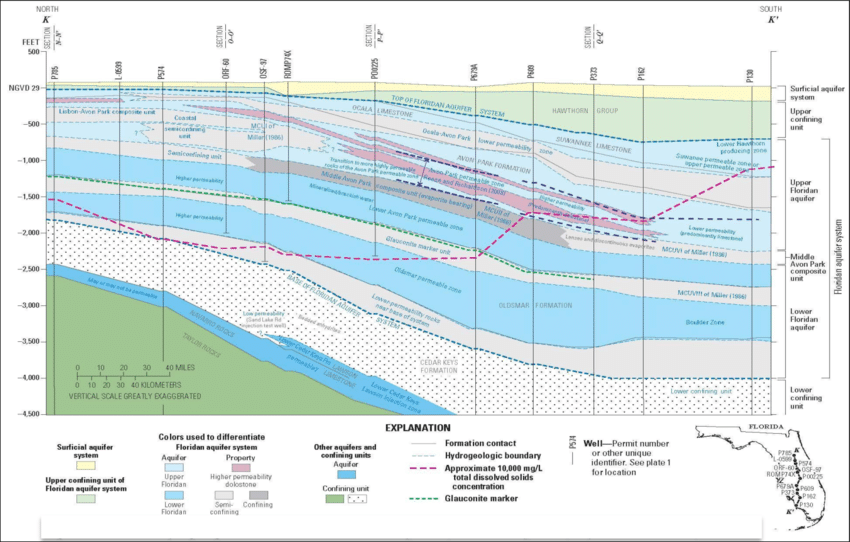
United States Geological Survey: Crosseection of the geology of the Floridian aquifer
Florida is a big state of some 66,000 square miles and it has a lot of people, nearly 25 million. About half of them depend on the Floridian aquifer as a water source. The interesting thing is most of the people who live in Florida are not from Florida. They are from big cities up north that primarily get their water from rivers. The majority of people in Florida if asked would probably not be able to say where their water comes from and after all why should they worry, as good grief, it seems to be plentiful. It’s not like California where there are all sorts of water restrictions and you have to landscape your yard with ugly white stones instead of grass. No when a Floridian turns on the tap they let it run.
The water may be plentiful but it is deemed hard by water treatment specialists. That’s because of the geology of the Floridian aquifer. To understand an aquifer you must understand the geology. Looking at Florida on a map you see that it looks like a tail wagging the dog of the North American continent. If you look at it from the air, it looks very, very flat. This is a result of how it was formed. Some 200 million years ago the supercontinent of Pangea began to break apart. As the North American continent slowly headed towards its present day position a shallow sea developed between it and the African continent. This shallow sea was an optimum place for the deposition of carbonate rocks and siliciclastic sediments. Thick sequences of interbedded limestone, clays and sandstones accumulated throughout the Cretaceous and on into the Cenozoic geologic time periods as the continents moved further apart.
During the Paleogene, about 60 million years ago, movement of the continents began to settle into what we might recognize on our current world map and the area where Florida exists today was a shallow marine platform beginning to form the tail of the North American continent. The era was characterized by rising and subsiding seas. Geologists call these transgressive and regressive sequences. So when the seas were high carbonate and siliciclastic rocks formed and when the seas were low the rocks were exposed, leading to what is called karstification – an interesting type of erosion where limestone is slowly dissolved by water as it percolates through the rock creating, vugs, channels and caverns.
Thick cumulation of sediments were continuously being buried by further deposits of sediments. As a result the underlying sediments began to compact. The low temperatures and pressure from this compaction as well as the infiltration of meteoric waters altered the rock. In some cases the rock would become dolostones as magnesium replaced calcium in the mineral structure and in other cases secondary porosity such as fracturing and solutioning would develop.
Lack of any substantial movement of the carbonate platform through faulting, or subduction/abduction of the continental plates led to only minor amounts of deformation of the area. There are only a few gentle geologic highs, like the Peninsular Arch which trends northwest to southeast and the Ocala Platform in north central Florida.
The major stratigraphic units of the Floridian aquifer were formed during the Cenozoic from about 60 million to 20 million years ago. From oldest to youngest they are the Oldsmar Formation, the Avon Park Formation, the Ocala Limestone, and the Suwannee Limestone. The Oldsmar formation is mainly dolostone and clayey carbonates that were deposited in the shallow restricted depositional basin. The Avon Park Formation is composed of interbedded limestone and dolostones with abundant karstification denoting its formation in the era of transgressive/regressive seas. The Ocala Limestone is the most continuous formation throughout Florida of the units that compose the Floridian aquifer. It Is composed of thick limestone layers formed in the offshore environment. The Suwannee Limestone is characterized by a fossil laden limestone formed in the shallow marine environment. These rock units are variable in thickness but reach greater than 1000 feet in north and central Florida.
This is a lot of aquifer. In north and central Florida where the aquifer is at its thickest, it transmits a ton of water throughout its continuous expanse. Recharge of the aquifer is direct and extensive. Some of the most prolific springs in the world are in this area. People today flock to the beaches in Florida but at one time the springs were one of its biggest tourist attractions. Go today and you can often see manatees making the springs their home.
Southern and Coastal Florida have a thinner sequence of the carbonate rocks and more siliclastic units forming thick sequences of rock where there is little recharge to underlying aquifer units. These barriers to water transmission are called confining zones and the Hawthorn Formation is its greatest representative. In the panhandle of Florida and along the Gulf and Atlantic coasts these siliciclastic rocks units dominate.
So the Floridian aquifer is a product of its geologic formation. Its thick sequences of interbedded sedimentary rocks and karstification is why it is so prolific in some areas and not others. Its dominance by limestone and dolostone is why the water is contains so much calcium and magnesium bicarbonate and is dubbed “hard”. Its predomiantly siliclastic nature near coastal areas and at depth result in fresh groundwater mixing with more saline or brackish waters making it less productive as a water source. But without the Floridian aquifer the state of Florida would not be able to maintain a population of its size. It is one of the greatest aquifers in the world.
The recently issued United Nations University Report Global Water Bankruptcy says: “The world is already in the state of “water bankruptcy”. In many basins and aquifers, long-term overuse and degradation mean that past hydrological and ecological baselines cannot realistically be restored. While not every basin or country is water-bankrupt, enough critical systems around the world have crossed these thresholds.”
Strong words and new words. What do they mean by “water bankruptcy?’ The term is defined in the report as the critical condition in which water resources are depleted or so severely mismanaged that they can no longer meet the essential needs of populations, ecosystems, and economies. The conclusion that we are now bankrupt is based on statistics. Very interesting. Not scientific proof, just statistics.
For example, the report says that nearly three-quarters of the world’s population live in countries classified as water-insecure or critically water insecure. Insecure is the mumbo jumbo word now used to mean insufficient. So, there is basically insufficient water for the population of these countries. The report also cites that about 4 billion experience severe water scarcity for at least one month a year.
Groundwater is reported to now be the source of 50% of global domestic water use and over 40% of irrigation water and that around 70% of the world’s major aquifers are showing long-term declining trends. Excessive groundwater extraction has in turn led to significant land subsidence because when you extract water and lower the water table, aquifer materials such as sand and silt compact. Compaction basically destroys the ability of the affected acquirer to recharge itself with water. The report says that over 6 million square kilometers—almost 5% of the global land area— is subsiding due to groundwater extraction.
Our biggest source of water though is surface water – rivers, streams, and lakes. They cite that a growing number of major rivers now fail to reach the sea (like the Colorado River – see my blog post here An American River in Distress ) or fall below environmental flow needs for significant parts of the year. No statistics are provided here; it’s just based on anecdotal observation. The report goes on to say that more than half of the world’s large lakes have lost water since the early 1990s, affecting around one-quarter of the global population that depends directly on them for water security.
Very interestingly the report states that about 70% of the world’s global freshwater withdrawals are used for agriculture and that more than 170 million hectares of irrigated cropland are under high or very high-water stress meaning again that there is insufficient water for irrigation at times.
So, what does the report say is the cause of global water bankruptcy? People. Of course, they couch it in terms of the “Anthropocene” the word now used to mean the period of time since humans have started affecting their natural environment with their activities.
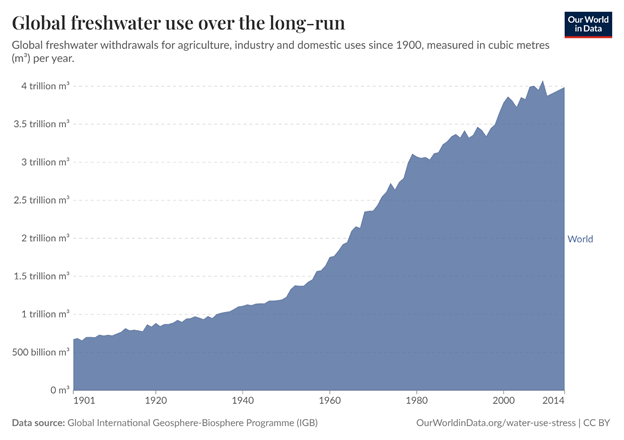
The chart I like best in the report is this:
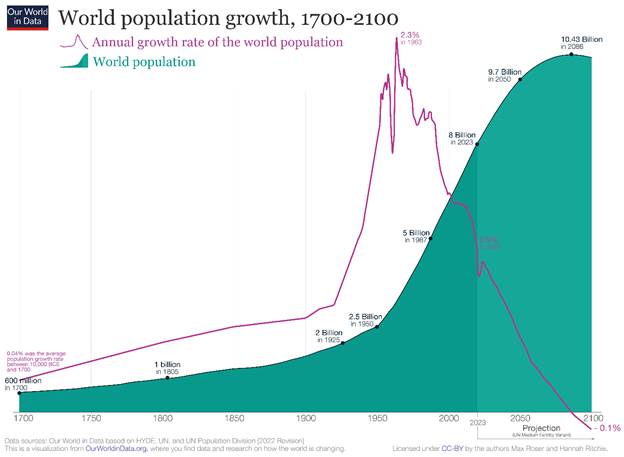
The chart shows the increase in freshwater use from the early 1900’s to today. Use rose precipitously starting in the 1960’s. They should have put the chart below right next to it because it shows an identical increase in population:
Trends indicate that by 2030, demand for water is expected to outstrip supply by 40 percent, driven by population growth, urbanization, and increased agricultural and industrial use. Apparently water bankruptcy will be the norm. However, the report provides no scientific measures for determining when a water system is in bankruptcy. Case studies are cited but there is no definitive presentation of a way to classify a system as bankrupt. In my view this is the big failing of this report. It only coins a new term and attempts to define it but lacks rigor in its presentation. So, the question still remains: are we in the midst of global water bankruptcy?
I will attempt in my blog to look into large water supply systems and determine if they are indeed in a state of bankruptcy. I will start with one of the most prolific aquifers in the United States – the Floridian.
When the Environmental Protection Agency (EPA) issued the Final Rule on regulation of poly-fluoro alkaline substances (PFAS) last week I had three questions. The first was: “Good grief 4.0 parts per trillion (PPT). Are there analytical methods that can even determine such a low number”. So I hopped on the EPA website and checked out EPA’s Technical Support Documents (TSD) for the new Rule. And yes indeed EPA says analytical methods can detect PFOA and PFOS to 4 PPT.
For purposes of regulation these numbers are referred to as the Minimum Reporting Level (MRL). An MRL is the minimum quantification level EPA has determined can be achieved with specified confidence by a large number of laboratories in the U.S. It is different from the Detection Limit (DL) which a lot of environmental professionals toss around in their daily lingo about sample analysis. Laboratory methods are so sensitive for PFAS chemicals that they can detect even lower levels than EPA is satisfied are actually real results. For those of you who are casual readers of this blog and are not familiar with analytical methods, EPA develops and maintains analytical standards for laboratories to use in testing for chemicals. EPA Methods 533 and 537.1 are required for analysis of the PFAS chemicals in the table above.
The table may look like a whole bunch of alphabet soup to you and you may be wondering what all these chemicals are. I have a previous blog post that you can read if you want to learn a little more about what the popular press have dubbed “Forever Chemicals.” Just check out this link here (https://waterblogger.org/category/contaminants/ ). Originally EPA was only planning on regulating PFOA and PFOS but in 2023 they decided to expand regulation to a couple other PFAS chemicals. Specifically, Hexaflurorpropylene Oxide Dimer Acid (HFPO-DA) and its ammonium salt known as Genx chemicals, Perfluorononanoic acid (PFNA) and Perfluorohexane sulfonic acid (PFHxS). Regulatory limits for drinking water were also placed on these chemicals in the Final Rule.
So my first question was answered. My second question was: “How big a problem is this anyway? Are there really that many drinking water systems out there that are contaminated with PFAS?” The EPA’s TSD supplied the answer to that as well. Back between 2013 and 2015 EPA required public water systems to conduct PFAS testing under the Unregulated Contaminant Monitoring Rule. Public water systems were monitored semi-annually. The study included all large and very large water systems which serve greater than 10,000 people. EPA found that 2 % of these systems are contaminated with PFOA and PFOS.
My third question was: “Are there any technologies that can actually treat drinking water to these very low levels of 4 PPT? And how much is this all going to cost?” Indeed the TSD confirmed that there are a number of technologies that can treat PFAS chemicals to reach those levels.
There are three main treatment technologies that can treat drinking water to the new MCLS: Granular Activated Carbon (GAC), Ion Exchange, and Reverse Osmosis/Nano Filtration
GAC uses a specially preprepared carbon media such as lignite or wood to adsorb contaminants from water. GAC media has the unique distinction among these technologies of being reuseable. Ion exchange employs an ion bead resin treated with an anion (typically chloride) as the media to exchange a strong bonding ion (fluoride in the case of PFAS) in water for a weaker one (chloride). Unfortunately the media once depleted has to be disposed of as a hazardous waste. Reverse Osmosis removes contaminants through forcing water through a membrane at high pressure. There are two effluents produced from the process. One is the treated water and the other is a brine which must be disposed of. The spent media can’t be reused and also has to be disposed of.
Another option was looked at too. Just replace the contaminated drinking water with a different source. This could mean switching to a surface water source if you have contaminated groundwater or drilling outside of the contaminated area for groundwater replacement.
Cost for the different treatment systems was calculated for both the capital cost of constructing the system and for annual operation and maintenance costs. Below are approximate costs that I attempted to ferret out from the graphs EPA provided in their TSD. Everything is in 2022 dollars so add on the annual inflation costs if you must.
The cheapest thing to do of course, if it is available to you, is to replace your drinking water source. Capital costs are estimated to be about $500K to $4M for capital costs and $5K to $100K annually for operation and maintenance.
Treatment System
Capital Cost
Operation & Maintenance Cost
GAC Large System
$5 – $100 M
$100 K – $10 M
GAC Small System
$100K – $1 M
$10K – $100K
Ion Exchange Large System
$2M – $100 M
$100K – $10 M
Ion Exchange Small System
$100K – $1M
$10K – $100K
Reverse Osmosis/Nanofiltration Large System
$5M – $100M
$200K – $12M
Reverse Osmosis/Nanofiltration Small System
$1M – $3M
$70K – $200K
All three of my questions answered. Yes these very low MCLs for PFAS in the new Rule can be analyzed for using EPA Methods 533 and 537.1, yes there are a good number (2 %) of public water systems that are contaminated with PFAS, and yes there are treatment technologies that can achieve MCLs, although it looks like they are pretty costly. If you have questions about the new Rule, please feel free to reach out to me and I will see if I can provide you with an answer from EPA’s lengthy documentation.
No, regulation of the Waters of the United States (WOTUS) is not my favorite topic to write about, even though I’ve now completed seven posts on the subject. The most I have written on any topic, because it has been and will ever be a never ending battle between the forces of science and the forces of development. Developers want to limit the application of Clean Water Act (CWA) regulations to “nonproductive” wetlands and upstream waters so they can infill them and use the land for houses, mines, agricultural fields, etc. Scientists though understand that the hydrologic cycle pretty much means every drop of water on earth is connected to every other drop of water and development in these supposedly disconnected wetlands and upstream waters will impact downstream waters considered to be WOTUS.
Scientific investigations continue to confirm the scientists viewpoint, including the recent Technical Support Document (TSD) for the 2023 WOTUS Rule now on top of the ash heap of Supreme Court Decisions. See my post from earlier this year if you want to know more (Supreme Court Decision on Waters of the United States ). I took up the TSD to see what new investigations have been conducted in support of the scientific viewpoint since the last great U.S Environmental Protection Agency (EPA) treatise on the subject in 2015 entitled “Connectivity of Streams and Wetlands to downstream Waters: A Review and Synthesis of the Scientific Evidence.” Here’s a link to my post on the 2015 Report (A Review of the EPA’s Connectivity of Streams and Wetlands ) if you want to do some catching up.
It has been eight years now since the 2015 Report so let’s see what recent studies the 2023 TSD cites in support of the global connectivity of water. EPA found 2,022 peer reviewed scientific papers published since 2015 relevant to the 2023 rulemaking. Scientists have been busy. Nothing spurs scientific investigation like a controversy and there was a lot of that after the 2015 Report was released. The 2015 Report supported a widely unpopular WOTUS Rule regulating upstream waters and wetlands. The 2023 TSD documentation mirrors the earlier 2015 report. It is divided into three areas of scientific investigation:
Ephemeral, intermittent and perennial streams
Floodplain wetlands and open waters
Non floodplain wetlands and open waters
The largest number of new investigations (986) concern ephemeral, intermittent and perennial streams. There’s a reason for this. It was the most controversial part of the 2015 regulation. Ephemeral streams are those that flow only briefly usually as a result of localized rainfall. Intermittent streams are those that flow seasonally. Perennial streams have continuous flow. It seems natural to most people that ephemeral and intermittent streams are not impacting downstream WOTUS much, but the people who live near these types of streams and are dependent on them think otherwise. Many of these water bodies are in the western part of the U.S. and they are often important upstream waters for protecting downstream water quality. When the Rule supported by the 2015 Report was pulled by the EPA, the first groups to sue were Indians tribes. As a result many scientists wanted to investigate how these ephemeral and intermittent streams are acting as headwaters for downstream flows and water quality. Ephemeral streams make up 48 percent of the stream length of all streams in the lower 48 states. That’s a pretty big number. The flow in ephemeral streams from precipitation events can have major effects on downstream waters due to abrupt increases in water that transport sediment, wood and other materials.
Although their stream beds may visually appear dry, they still have water flow in the hyporheic zone (the stream bed lying below the surface.) EPA cites Gallo and others in a 2020 study showing ephemeral and intermittent streams are providing valuable groundwater recharge from the hyporheic zone. Although ephemeral and intermittent streams might have observable flow only 1 to 82 % of the time, the presence of water in the hyporheic zone exists 4 to 33 times longer.
Other studies cited by EPA include those of Covino and Magliozzi in 2018 showing ephemeral and intermittent steam without surface flow have complex and abundant hyporheic flow that maintain a downgradient hydrologic connection by supplying surface flows and maintaining habitat.
The second largest number of publications covered investigations of floodplain wetlands (660 scientific papers). The 2015 Rule pretty much included all floodplain waters as being WOTUS. in its definition of what an adjacent covered wetland to a WOTUS is. Of course that Rule was pulled in 2020 and the new rule that came in restricted what could be regulated as an adjacent wetland.
Floodplain wetlands are actually part of stream and river systems with intricate connections, interactions and exchanges with them. For example when river banks overflow during floods, floodplain wetlands serve as overflow storage. Also there is a groundwater connection between a surface water body and it’s floodplain wetlands.
EPA cites a paper by Webb and others published in 2017 that shows how flood inundation of wetlands surrounding a surface water body contributes 72 to 76 percent of groundwater discharges to rivers. Simultaneously these inundated wetlands are being provided nutrient rich waters from the flooding stream systems. It’s a sort of symbiotic relationship. One can’t be disconnected from the other without impacts to both. So if you infill a wetland, the flows that feed downstream surface waters are diminished and the nutrient sink that is the wetland is gone. Nutrients like nitrogen and phosphate are free to flow into surface waters where they can, as we all know, create a bunch of havoc. In fact Gordon and others in 2020 showed that floodplain wetlands remove an average of 200 kilograms of nitrogen per hectare over a years time and 21 kilograms of phosphate.
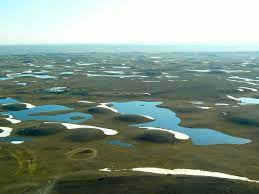
Non floodplain wetlands had the fewest number of scientific investigations at a disappointing 491 published papers Non floodplain wetlands are often dismissed by just about everyone as unimportant and “nonproductive”. These are waters like prairie potholes. The research that has been conducted since 2015 is pretty conclusive as to the connectivity of these isolated wetlands with WOTUS even if a great part of the connection is to keep surface runoff from reaching downstream waters.
These non floodplain wetlands comprise 16 percent of all wetlands in the lower 48 states by areal extent. A huge number still considering how many have been infilled for all types of development. EPA cites a literature review by Lane and others of all studies of non flood plain wetlands. Their paper shows these isolated waters are all interconnected in some way to river systems, either through storing storm waters so they aren’t washed along with a bunch of nutrients downstream or serving as a source of base flow of groundwater to rivers during dry periods. Another study cited by EPA is that by Thorslund and others who conducted an investigation in 2018 using chloride tracers to study how non floodplain wetlands in Florida contribute surface water to downstream river and streams. The study showed nonfloodpain wetlands are a watershed scale source of flow for 90 percent of Florida’s headwater streams.
The TSD also cites Brooks and others who performed a similar trace study using isotopes in North Dakota. The researchers found significant amounts of water from isolated wetlands are providing water to downgradient perennial streams. Rains and Cohen both published papers in 2016 showing how non floodplain wetlands can attenuate surface water flow and provide storage on a watershed scale that helps prevent devastating floods.
Also like the floodplain wetlands, studies have shown non floodplain wetlands to be a dramatic reducer of nitrates, phosphates and carbon. Cheng and Basu in 2017 showed that 50 percent of nitrogen removal across all water bodies occurs in small wetlands and Evenson and others. in 2021 found through watershed modeling that restoring just 2 percent of non floodplain wetlands in the Upper Mississippi basin would result in a 12 percent nitrate reduction. This would be an amazing achievement if it could be done to help eliminate the dead zone in the Gulf of Mexico caused by unchecked nutrients washing off farm lands into the Mississippi River.
So I guess I can say in summary that scientists have advanced the state of knowledge of how ephemeral and intermittent streams as well as non floodplain and floodplain wetland are connected to traditional downstream WOTUS. EPA goes as far as to say that “after analyzing the abstracts of all 12,659 papers published since 2014, the evidence is conclusive that ephemeral, intermittent and perennial stream, floodplain wetland and non floodplain wetlands are hydrologically, chemically, biologically and functionally connected to downgradient waters.” The EPA has also calculated the value of these type of headwaters through their benefits to society including fishing, hunting, boating, bird watching, religious uses, production of fuel, forage and fibers, extraction of materials for biofuels, food such as shellfish, and medical compounds. The dollar value assigned to headwater streams is $15.7 Trillion annually and that calculated for non flood plain wetlands is $673 Billion annually. This looks to me like a pretty significant economic contribution from a bunch of upstream waters that people have been dismissing as “non-productive”.
What is the difference between “adjoining” and “adjacent”? The difference in the definition of the two words is what it all came down to in the May 2023 Supreme Court decision on the inclusion of wetlands in the Clean Water Act’s (CWA) definition of the Waters of the United States (WOTUS). The letter of the law in the CWA is “it is unlawful to discharge dredged or fill material into “navigable waters” of the United States, tributaries of such waters and adjacent wetlands.”
Judge Alito in his Opinion says “adjacent wetlands must be a relatively permanent body of water connected to traditional interstate navigable waters and the wetland has a continuous surface connection with that water, making it difficult to determine where the water ends and the wetlands begin”. This interpretation of the meaning of adjacent is consistent with the Supreme Court decision made years ago in a case commonly referred to as Rapanos. However Justice Kavanaugh in his Opinion writes that the word “adjacent” is used incorrectly by Judge Alito. Kavanaugh says Alito is defining the word “adjacent” as meaning “adjoining” wetlands and that “adjacent” and “adjoining” have two different meanings.
According to Justice Kavanaugh, “adjoining” means wetlands contiguous to or bordering a navigable water and “adjacent” includes adjoining wetlands and wetlands separated from navigable waters by manmade dikes or barriers, natural river berms, beach dunes and the like. Judge Kavanaugh points to the fact that these types of wetlands have been regulated by the U.S. Environmental Protection Agency (EPA) since 1977 and there has been a consistent meaning for “adjacent” over the last 45 years.
If you’ve been keeping up with my series of blog posts on the definition of WOTUS over the last seven years you will know that the EPA has been trying to write regulations on what WOTUS means and how to apply that definition. There have been three rewrites now – one for each of the past three presidential administrations. You can read my post on the latest version published last year here https://waterblogger.org/category/water-quantity/ . EPA attempted to include the “significant nexus test” in its last rewrite of the regulation. This test came from a conflicting opinion by Judge Kennedy that muddied the waters of the so called Rapanos decision mentioned above. He wrote that the “CWA jurisdiction over adjacent wetlands requires a “significant nexus” between wetland and navigable water which exists when “the wetland, either alone or in combination with similarly situated lands in the region, significantly affect the chemical, physical and biological integrity of those waters.”
EPA has been using this test for quite some time now and has an extensive guidance document for field personnel to use in deciding whether a wetland meets the criteria for “significant nexus”. They came upon a bit of difficulty with implementing this test though when they issued Mr. and Mrs. Sackett of Priest Lake, Idaho a violation for infilling wetlands on property where they were trying to build a home. The Sacketts sued. The Sacketts property is located across the street from a ditch that leads into a creek which eventually feeds into Priest Lake, a navigable intrastate lake that is considered a WOTUS. The EPA’s contention was that the wetlands on the Sackett’s property were similarly situated with the Kalispell Bay Fen wetland nearby and therefore constituted WOTUS.
The Ninth District Court ordered summary judgment for the EPA in the lawsuit saying that “the CWA covers wetlands with an ecologically significant nexus to traditional navigable waters and the Sackett’s wetland satisfied the standard.”
The case was appealed by the Sacketts and arrived last year (nearly 20 years after they bought their land on Priest Lake), to be argued in front of the Supreme Court. All nine Supreme Court justices ruled in favor of the Sacketts, saying their property did not meet the definition provided in the CWA for being considered “adjacent wetlands” and that EPA’s “significant nexus” test is not covered by the CWA.
This ruling must be a huge blow to the Office of Water at EPA and fill its corridors with woe. A lot of time has been taken up over the last 12 years writing and rewriting regulations. Now their latest rule on definition of WOTUS has been thrown out by the Supreme Court and regulatory jurisdiction over many traditionally regulated wetlands has been called into question. Lots of people warned them about this potential outcome when they proposed writing regulations on WOTUS back during the Obama Administration. Now it has all come to fruition.
Albert Einstein once said that the definition of insanity is doing the same thing over and over again and expecting different results. In the last eight years there have been three rewrites of the definition of the Waters of the United States (WOTUS) under the Clean Water Act (CWA) by the U.S. Environmental Protection Agency (EPA) and its co-regulator The Department of the Army who administers part of the law through the U.S. Corps of Engineer (Corps.) For some history on the subject seek out my blog post at this link ( Environmental Protection Agency Announces Clean Water Act Rule.)
The first rewrite was in 2015 and it was termed the “Clean Water Rule” but should have been titled the “Clear as Mud Rule” (see Environmental Protection Agency Announces Clean Water Act Rule .) This was replaced in 2020 by the “Navigable Water Protection Rule” which should have been titled “The Do Anything You Want Rule” (see Waters of the United States .) Now we have the new 2023 “Revised Definition of the Waters of the United States.” You could call this insanity or use my word for it – silly. The pre 1985 regulations were working just fine until in 2006 the Supreme Court – well known as an august scientific body – stepped in with a criticism of the process. Their beef was that they kept getting cases challenging the decision of the Corps on administration of the part of the law they are responsible for – the CWA 404 (d) rules regulating the disposal of materials into waters of the U.S. including wetlands.
There is a long history of disputes through the court system on application of the CWA regulations and sometimes they reach the Supreme Court. This is what happens when you have a poorly written law, however no one wants to rewrite the CWA as these days that might result in wholesale slaughter of the Act or, so I was told a few years ago by senior officials at the Department of Justice. So now we get these silly continuous rewrites of the regulations.
The 2023 rendition started out well as it purported to go back to the original 1985 regulations, but then the regulators decided wouldn’t it be just dandy if we include two different tests to determine if nearby wetlands or upstream tributaries to traditional (a)(1) WOTUS are WOTUS too.
The definition of (a)(1) waters is straight from the CWA:
Waters of the United States
(a) Waters which are:
(i) Currently used, or were used in the past, or may be susceptible to use in interstate or foreign commerce, including all waters which are subject to the ebb and flow of the tide;
(ii) The territorial seas; or
(iii) Interstate waters, including interstate wetlands
The two tests included in the new regulations are:
the “relatively permanent standard,” and
the “significant nexus” standard (which has been informally used for a number of years after a 2006 Supreme Court decision in which Chief Justice Kennedy wrote that this was the test an adjoining water body should pass to be considered a WOTUS.)
The “relatively permanent standard” is a fairly understandable test whereby a wetland or upstream tributary will be considered a WOTUS if it is: “a relatively permanent, standing or continuously flowing waters connected to (a)(1) waters and waters with a continuous surface connection to relatively permanent waters.”
But what in the world is a significant nexus? The new rule defines it as tributaries or wetlands that “either alone or in combination with similarly situated waters in the region, significantly affect the chemical, physical, or biological integrity of waters identified in paragraph (a)(1) of this section.”
This means if you want to develop a property within a tributary or wetland in a wide vicinity of one of these (a)(1) waters then CWA regulators must decide if the water on your property is affecting them. If the wetlands or small steams from your property are filtrating or reducing sediment, contaminants of other sorts, or harmful biological matter from the (a)(1) waters than you’re likely not going to be able to develop there. Or say the waters on your property provide for the extant water sources of (a)(1) water that support biological resources such as fish and the chain of biological organisms they feed on then you’re not going to be able to develop there either.
Welcome to the water wars. They’ve been going on for over a hundred years in the U.S. The wars are just getting larger due to increased population growth and consequent development. The current rewrite of the definition of WOTUS will do nothing to solve the legal challenges. It throws the problem back again on the regulators to make the decision of whether a particular property is a WOTUS or not, just as it always has been.
There is already a challenge to the “significant nexus” standard as defined in the new regulation. The case of Sackett vs. the EPA was taken up by the Supreme Court in late 2022. In brief this is an old dispute dating back to 2007 where a property owner was attempting to infill a wetland for development and was stopped by the EPA for violating the CWA. That’s why I started this blog post with the definition of insanity. Depending on the Supreme Court decision, we may yet see another rewrite of the WOTUS regulations. You can probably tell by the tone of this blog post that I’m getting fed up with the whole issue but I’ll continue to update my readers on this ongoing silly saga.
This is my fourth and final post on the 2021 report: Climate Change: The Physical Science Basis by the United Nations International Panel on Climate Change. I promised four posts covering ocean warming, sea level rise, salinity changes, and finally the subject of this post – ocean acidification. Acidification sounds scary doesn’t it? You might imagine a big rolling sea of water that can burn your skin off. It’s not that bad, but it’s still somewhat frightening. Now I don’t mean to scare people through my blog, that’s big media’s business. I want to inform people who don’t have the time to read thousands of pages of scientific documents about their contents. My blog posts are designed to provide you with a nuts and bolts synopsis of critical water issues plaguing the world today. But sometimes the data can be pretty worrisome.
So let’s get the scary bit out of the way shall we. The IPCC report points to the oceans absorption of carbon dioxide since the 1980s as being in the range of 20 to 30 percent of all human carbon emissions. As a consequence the pH of the ocean surface has declined 0.017 to 0.027 units per decade since the 1980s and subsurface pH up to a mile in depth have declined by 0.003 to 0.026. If you want to know more about how carbon dioxide impacts ocean pH you can find it here https://waterblogger.org/general-information/ocean-acidification-climate-change/ .
You may be asking yourself why such a small decline in pH is so scary. We have to do some chemistry to explain. As the ocean water absorbs carbon dioxide from the air a chemical exchange occurs, producing carbonic acid – H2CO3. The carbonic acid dissociates, generating HCO3 and H+. What this means is that carbonate ions (CO3) in the water are decreased and bicarbonate (HCO3) ions are increased. It basically changes the whole carbonate chemistry of the ocean. You might not care but all the little critters that make their shells from calcium and carbonate in the ocean’s water do. Calcium carbonate saturation rates of seawater have been declining at rates of 0.07 to 0.12 per decade.
What I find particularly fascinating in the 2021 IPCC report though is the variation in pH decrease that has been measured in different parts of the ocean now, for example the tropical Pacific Ocean is decreasing in pH at a greater momentum than other ocean areas, while the western tropical Pacific Ocean (renowned for its warm pool of water) shows slower pH declines. Coastal areas are acidifying at a greater rate than elsewhere as waters there are supersaturated with carbon dioxide. What’s happening at depth is interesting too. The well known meridional overturning circulation zones, such as the one in the Atlantic Ocean characterized by the Gulf Stream, bring warm water from the lower latitudes into the Polar Regions where it cools and sinks thereby producing acidification in the deep ocean. Areas like the subpolar North Atlantic Ocean and the Southern Ocean have the highest acidification found at depths greater 2 miles.
Governments are busy trying to decrease carbon dioxide emissions. The results will reverse ocean acidification at the surface, but not at depth due to the long time scales of ocean turnover. This will result in a lasting legacy in the deep ocean and impact biological resources for thousands of years to come.