Category Archives: Water Quality

Topics on water quality of surface water and groundwater.

The Polluting suburbs

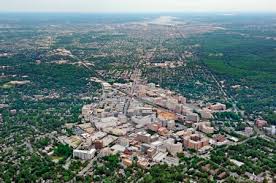
Aerial view of Silver Spring, Maryland – a suburb of Washington, D.C.

Have you been to Washington D.C.? It’s a favorite tourist destination for many. Most people who visit the city confine themselves to the National Mall where the monuments and historic sites can be seen.  The downtown area is similar to other major cities, with extensive office blocks, condominiums, and small businesses like restaurants and retail stores, however Washington, D.C. is unique in never having had major industrial activity like manufacturing or refining as its economic engine is the federal government. Few who don’t live there realize the extent of the city’s surrounding suburbs. Urban sprawl stretches west to Manassas, Virginia, south to Fredericksburg, Virginia, north to Frederick and Baltimore, Maryland, and east to the Chesapeake Bay. The vast suburban enclaves wrapping themselves around the city’s core choke off the natural processes of the water cycle with their immense impervious surfaces of concrete, asphalt, and roof tiles. What is this unnatural environment doing to our precious water resources? A good look at the impact of this overdevelopment can be found in the 2019 U.S. Geological Survey (USGS) Scientific Investigation Report (2019-5092):  Sediment and Chemical Contribution Loads in Tributaries to the Anacostia River

            The Anacostia River flows through Washington, D.C. and empties into the Potomac River. The USGS study is part of a larger scientific investigation of the Anacostia River’s pollution sources.  The U.S. Environmental Protection Agency set Total Maximum Daily Load (TMDL) values for the Anacostia River in 2003 for 16 different pollutants. The goal of setting TMDLs is to make a water body comply with a determined use, which in this case is to make the Anacostia River both swimmable and fishable – a tall order even for a city without a lot of industrial activity. The few industrial sources of contamination have been identified. They consist of a power plant, a gas plant, a bulk fuel storage area, and a couple of city landfills. These sources have been studied and are well understood. Most of them now have control measures installed to prevent future pollution to the river.  Contaminated sediments in the Anacostia from these sources have been pinpointed and singled out for removal so that  they will no longer be a continuing catchment of contaminants polluting the river far into the future. However the question becomes: will the water in the Anacostia River meet the TMDLs set by the EPA after the removal of these old contaminant sources or will the urbanized environment just continue to pollute the river and make TMDLs unachievable?  In other words, can the river be made clean again? Will people ever be able to safely eat fish from the river? Will they be able to swim and recreate in the river without concern?  

            Part of the continuing pollution of the river comes from the city itself. Storm and sewer drain studies have shown how the run-off from the city’s streets and yards are contributing to the pollution of the river. See my last post on Are Cities a Point Source of Pollution (Are Cities A Point Source of Water Pollution?)  But what about the urbanized areas surrounding the city?  What are their contributions? After all the entire city is small in comparison to the larger metropolitan area. The USGS study seeks to determine what the overall pollutant loads are from the tributaries of the Anacostia. The main tributaries with the largest basins and the greatest lengths are the Northwest Branch and the Northeast Branch. These branches are the two main tributaries which join to form the Anacostia River. The sources of both branches are in Maryland. The Northwest Branch drains much of the suburban areas of Montgomery County, Maryland while the Northeast Branch flows through Prince Georges County, Maryland. Both of these counties are monolithic representations of modern living with intense suburbanization, long streets clustered with parking lots, strip malls and shopping centers, residential developments with minimum space between houses and practically no yards, highways like the famous Beltway, and schools, churches and hospitals crammed into narrow spaces. Impervious surfaces, imposed by pavement and houses through which no rainfall can penetrate, vary from 20 percent in the upper portion of the basin to 50 percent at the confluence of the two branches. Both branch basins are densely populated. About 47 square mile out of a total 122 square mile area over which the tributary basins extend are covered with residential development. There are very few parks and any forest land is limited to that found along the riparian corridors of the branches. Just 13 square miles within the basins are forested. Agricultural lands make up only12 square miles. The two branches combined provide most of the water supply for the Anacostia River – 32,900 million gallons a year. They also contribute most of the sediment and the largest amount of Polyaromatic Hydrocarbon contamination flowing into the Anacostia. The USGS calculates that 89,000 grams of PAHs flow into the Anacostia from its tributaries every year. Seventy two percent of it comes from the Northwest and Northeast Branches. This is not surprising considering the urban nature of these two tributaries and the amount of sediment they are carrying. Out of 30,500,000 kilograms of sediment contributed by all tributaries to the Anacostia, 26,000,000 kilograms is coming from the Northwest and Northeast Branch with the Northwest Branch contributing the most. Considering that contaminants are primarily transported with fine grained sediment, it is not unexpected that the greatest amount of PAH contamination is coming from these two waterways.

            Completely surprising is where the greatest amount of Polychlorinated Biphenyls (PCBs) is originating from – Lower Beaver Dam Creek. This tributary to the Anacostia originates solely from Prince Georges County, Maryland. Its basin is fairly small – 14.9 square miles – but it has an outsize contribution of sediment to the Anacostia, nearly 4,500,000 kilograms a year. This amounts to 3.01 kilograms per year for every square mile. Obviously Prince Georges County needs to put some erosion control measures into place. Entrained within the sediment is a huge load of PCBs being carried along by the water in the creek.  The PCB levels in Lower Beaver Dam Creek are magnitudes greater than any other tributary to the Anacostia. The USGS calculated that stream water in the creek has an average concentration of 130 micrograms per kilogram. Compare that to Northwest Branch with 6.6 micrograms per kilogram. About half of the creek’s basin is covered in residential development. The impervious surface is estimated to be about 32 percent or 7 square miles. Forested land makes up only 3.5 square miles and agricultural land some 6.6 square miles.  There’s also a small amount of industrial use (less than 1 square mile.)  The source of the PCBs in the creek is not known. The total annual amount of PCBs calculated by the USGS as entering the Anacostia from its tributaries is 860 grams per year, seventy five percent of that is coming from Lower Beaver Dam Creek.

             So how is this all going to affect the ability of current measures envisioned to protect the Anacostia River by removing known sources of PAHs and PCBs in the river’s sediments? And can the Anacostia River ever meet the TMDLs set by EPA? Well I suspect that’s all up in the air right now, because Northwest and Northeast Branch and Lower Beaver Dam Creek as well as a couple of smaller tributaries solely originating within Washington D.C. (Watts Branch and Hickey Run) are exceeding the contaminant load allocations set for those water bodies under TMDLs, in some cases by a factor of 200. What new measures will have to be implemented to control and reduce contaminants coming from the Anacostia River’s tributaries? And how will Washington D.C.’s environmental regulatory agency get  cooperation from another state, in this case Maryland, to implement what could be costly and possibly disruptive practices to reduce contaminants that are essentially being introduced into waterways by suburban sprawl? If you want to know then look at the Chesapeake Bay Program where currently the state of Maryland is suing states upstream of the Susquehanna River that are contributing a huge share of the contamination to the Bay and doing little to prevent it.               It’s clear from the USGS study that suburban areas, with dense populations creating extensive impervious surfaces (e.g. parking lots and streets), are a significant contributor to the contamination of streams and rivers. The runoff from paved surfaces after a rainfall is washing contaminants off suburban streets and transporting them into nearby streams. Additionally the heavy flow of water caused by runoff is eroding stream banks, resulting in a huge amount of sediment with entrained contaminants being carried downstream and into our rivers. The lack of natural rainfall percolation through soils is resulting in a new contamination source – the suburbs.   
Are Cities A Point Source of Water Pollution?

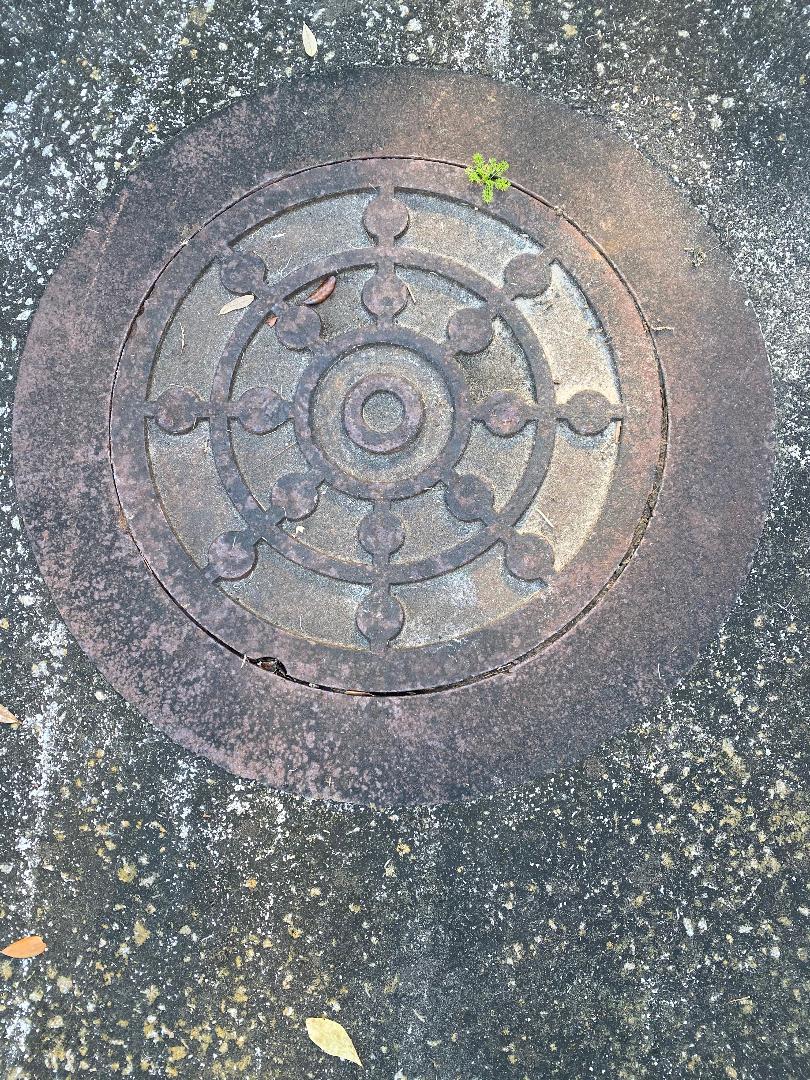
You drive over them all the time and never even notice except if they have been poorly installed or have subsided into the pavement and your car tire hits them with a thud.  Manhole covers.  They are ubiquitous in the urban environment and are covering up a multitude of sins.  Below them lurks the city sewer system.  You may have visions of sewers being filled with rats and roaches; no place that you plan to visit, just a reality of modern life.  Most of the manholes are covering the storm sewers that drain a city of rainfall and snow melt.  The storm sewers in a new suburb are not connected with the wastewater sewers that empty from your sinks and toilets, but in many of our older cities in the United States such as Washington, D.C. some of the storm sewers are combined with the wastewater sewers.  I know you are thinking “Yuck” and me too.  In Washington D.C., sixteen of these combined sewers flow directly into the Anacostia River during storm events with loads of e.coli and fecal coliform because of the lack of capacity at the wastewater treatment plant. 

            The uncombined sewers that simply deliver storm water to the Anacostia River are not benign either.  Because of the wash of water during storm events and after snow melt, the sewers transport sediment washed from roads and green spaces like yards and parks, trash including glass and metal, and leaves and other organic detritus.  The sediments contain the urbanized contaminants of the city.  A type of urban contaminant you might find in storm sewers are Polychlorinated Aromatic Hydrocarbons (PAHs) that form as a result of incomplete combustion of fossil fuels in power plant emissions but also are emitted with car and truck exhaust.  PAHs are components of asphalt and automobile tires as well.  Simple tire wear on the streets of our nations and the existence of asphalt pavement results in a polluting source of contamination to our waterways.  Polychlorinated Biphenyls (PCBs) are another urban contaminant.  PCBs were used in all sorts of electrical equipment that supports a city’s electrical power grid:  transformers, capacitors, voltage regulators, and switches.  PCBs also were used in motor and hydraulic systems, insulation, oil based paint, and a whole host of other crazy stuff that are part of the urbanized environment.  Long banned for use, they continue to persist in urbanized areas because they don’t degrade to any extent.  Dioxins which are also formed from fossil fuel combustion, pesticides such as DDT and chlordane that once were widely used throughout cities for pest control, lead from bridges, corroding metal surfaces, paint, and old combustion of lead gas, arsenic from pesticides and fertilizer used to treat wood in outdoor decks and walkways, and mercury from combustion of coal and oil in power plants are all urban contaminants.

            When storm water and snow melt clears the streets of a city, all of these urban contaminants flow into and through the sewer systems and discharge directly into our rivers.  It is hard to tell in most cities to what extent urban living is contributing to the pollution of our waterways, because in addition to city contaminants there is also the contribution of pollutants from run-off at both old and new industrial sites.  These industrial sites, if still operating, are often considered point sources of contamination under the Clean Water Act and not just from effluents that might be leaving the sites via pipes and culverts, but from storm water runoff at the property itself.   Washington, D.C. though has no large scale industrial sites contributing to the Anacostia River; there are just a few old city landfills, a couple of power operators, and a few petroleum storage areas that are part of any city’s urban legacy.  The few military bases are old, really old, (for example the Navy Yard was established in 1799) and they were not major industrial operations.   So I was excited to see as part of the Anacostia River Program, which promises to make the water in the river fishable and swimmable, a study was being conducted on the contribution of upgradient sewer systems to the contaminated sediments at outfalls flowing into the river.  Here was a chance to define to some extent what the contribution of contamination by the city itself is to the Anacostia River.  I read eagerly through the “Manhole Sediment Investigation Report” completed back in December 2019. 

            Outfalls along the Anacostia were sampled for contaminants as part of an earlier study.  Outfalls of the sewer system make little delta like formations where a pipe or culvert drains water into the river.  Sediments from 16 of the combined sewer outfalls and 35 of the storm water only outfalls are considered contaminated.  The idea of the study was to use manholes to collect sediments out of the sewers to assess the level of contamination being contributed to the river by upgradient sources.  Washington D.C.’s Department of Environment and Energy wants to clean-up the contamination in the river to achieve its goal of making the river safe for swimmers and fishermen, but is concerned about possible continuing upgradient sources of contaminants that could re-pollute the river after the cleanup. 

            One hundred fifty seven manholes upstream of the contaminated outfalls were identified for inspection. Only 38 of the manholes were actually sampled for two primary reasons: 1) many of them could not be opened, and 2) many lacked enough sediment to be chemically analyzed.  The lack of sediment in many of the sewers is not surprising because think of how storm events proceed.  A good one washes the streets clean with a torrent of water which enters a storm drain aligned with a multitude of other storm drains and the rush of water down the sewer pipe and into the river is turbulent and almost violent.  Everything is blasted out of the sewer including most of the sediment.   

     Here’s what the study concluded from the 38 samples taken.  All sewers that discharge to the Anacostia are washing contaminants into the waterway.  It wasn’t possible to directly correlate the levels of contaminants found in sediments taken from the sewers to those from the outfalls.  This is because the sediments taken from the manholes contain a much lower level of organic carbon, clay and silt than the sediments at the outfalls. Such low levels are a result of the turbulent flow that carries the small particles, of which these types of sediments are composed, out of the sewer and into the waterway.  Contaminants preferentially absorb onto organic carbon, silt, and clay.  However, where manholes provided enough sediment for chemical analysis, they were found to contain notably higher levels of contaminants compared to the background of these contaminants in the river.  Many of the contaminants from the sewers are 20 to 50 times higher than background in the river sediments. 
            Interestingly some of the highest levels of PCBs from the sewers were not where you would expect them to be – near the power generation sites – but are instead in the area upstream of the Washington Channel and Tidal Basin, where there are no known contaminated sites.

            Because of the limited sampling, the study doesn’t provide an overall picture of how much the city is contributing to the pollution of the Anacostia River, but the results are alarming enough for the study participants to recommend further upstream manhole sediment sampling to see if the sources of the contamination in the sewers can be tracked down and identified – a difficult and expensive undertaking.   It’s questionable as to whether individual sources could ever be found.  Perhaps urban contaminants are so ubiquitous in a city that vast water management measures will need to be taken similar to the ones now being implemented on the Chesapeake Bay where wide land use issues are contributing to the nitrogen and phosphate pollution.  In order to meet Clean Water standards, will cities in the future have to implement actions like rain gardens, green roofs, installation of pervious pavement, runoff controls, and water treatment at outfalls.  I suspect this small manhole sediment study has opened the eyes of many environmental regulators tasked with keeping our rivers clean of pollutants.  The study verifies that it is not just contaminated sites like landfills and power plants that are polluting our urban rivers; it is also the city itself.        

The Urban River

Anacostia River

Everyday tens of thousands of commuters in eastern Maryland get into their cars and drive to their jobs in Washington D.C. (D.C.).  They most often commute into the city via New York Avenue, Benning Road N.E., or Pennsylvania Avenue.  No matter what route they take, they have to cross the Anacostia River.  Most of the commuters probably don’t know the name of the river they are driving over or even give it a second glance as they weave through some of the worst traffic congestion in the country.  It’s not a big surprise why drivers ignore the river.  It is perhaps one of the worst looking water bodies in the country.  It is a wide, flat, slow moving, reddish brown, algae matted mess barely discernible as water.    

          The Anacostia has a small watershed of 176 square miles.  However the entire extent of the watershed is within the urbanized and suburbanized confines of D.C., Montgomery County and Prince Georges County, Maryland.  The Anacostia eventually flows into the more well known Potomac River near Hains Point and the Washington Ship Channel.  The Anacostia is one of the best examples in the country of a river where most of the environmental impacts are caused by the urban environment as opposed to past industrial waste disposal practices.  Although there are a number of contaminated sites along the river, they are mostly sites associated with urban living – municipal landfills, utility companies, and petroleum storage yards.  The only odd ducks are the military bases which are present in large numbers in the country’s capital.  But the two military sites located along the Anacostia had little industrial activity and most of it was long ago.

          The river’s chief environmental problems are suspended sediment which gives it that nasty brown color, nutrients like nitrogen which cause the algal blooms, and e. coli and fecal coliform.  The latter two contaminants are pathogens. Their presence in the river is due to a combined storm and wastewater sewer system which regularly overflows the Blue Plains waste water treatment plant, dumping untreated human waste into the Anacostia River.      

          The District of Columbia’s Department of Environment and Energy (DOEE) has been monitoring the Anacostia, along with all the other water ways in its jurisdiction, for years.  The agency produces regular reports on their findings.  Their most recent report in 2016 is entitled: The District of Columbia Water Quality Assessment Draft Integrated Report.  The report provides water quality data on the state of D.C.’s rivers and streams and outlines a program the DOEE has implemented to meet the tough goal of making all water bodies in the area swimmable and fishable.  According to the report, there are no current waters in D.C. which support all designated uses.  A “designated use” is a term that is used by environmental regulators to describe the activities people should be able to engage in a water body, like fishing and swimming.  So the Anacostia River is not an outlier.  Even Rock Creek, the beautiful stream that descends through Rock Creek National Park doesn’t meet its designated use of swimming because of e.coli or its designated use of fishing because of polychlorinated biphenyls (PCBs).

          The causes for water impairment in all of the water bodies of D.C. are myriad because of the urban nature of the surrounding land. Pesticides are abundant in soils because of past widespread spraying for mosquitoes and other pests, PCBs which were once used in electric transformers are everywhere, and polycyclic aromatic hydrocarbons (PAHs) as well as oil and grease wash off of the city streets. All of these contaminants enter waterways as a result of storm water flow.

          The Anacostia River has the same problems that all the other D.C. water bodies receiving storm water runoff have.  But in addition to contamination from the storm water inputs, it also has the problems caused by the old municipal landfills, utility operations, etc.  How can the effects of the two different sources of water degradation be separated?

          This is an important question because the Anacostia is the subject of a large scale river cleanup program prompted by the National Park Service which has administrative functions given to it by Congress for the National Park land along the Anacostia River and for the banks of the tidal portion of the river.  DOEE and the National Park Service have instigated a Remedial Investigation study under the Comprehensive Environmental Response, Compensation, and Liability Act (CERCLA) more widely known by the public as the Superfund Law.  The Anacostia River is also included under the U.S. Environmental Protection Agency’s (EPA) Urban Rivers Program.  Further the Anacostia River is a target for the Chesapeake Bay Program because the excess nitrogen and e. coli from D.C.’s combined waste water and storm water sewer system is contributing to the poor water quality in the Bay.

A number of programs have been implemented to improve water quality impairments from the combined sewer system.  D.C. Water, the water system operator in the city, has a long term control plan which involves the construction of four enormous underground tunnels to hold millions of gallons of the combined sewer flow so that it doesn’t overwhelm the wastewater treatment plant.  An upgraded treatment plant is also in the works, as well as a replacement program to separate wastewater and storm water sewers.  All of these activities are costing billions of dollars and should improve water quality in the Anacostia River.

          But those activities won’t solve the problem of existing contaminants like PCBs, dioxins, and pesticides found in the sediments of the Anacostia River.  According to the Remedial Investigation conducted under CERCLA, the sediments are the chief source of human health and ecological risks posed by the river.  The risks are attributed to the exposure of invertebrates, fish, and fish larvae to the contaminated sediment.  Fish larvae which come in contact with the contaminants are impaired in their ability to survive and grow.  Fish that do survive feed on contaminated invertebrates in the river and accumulate those contaminants within their tissues.  As a result, fishermen are advised not to eat what they catch.    

          The contamination is certainly there. There are hundreds of samples of sediment and fish with evidence of the contamination, but is the contamination from the old landfills, utility operations, and military bases or is it from the urban storm water flow that comes off the city’s streets and green spaces?  At this point the Remedial Investigation provides no answer but defers the issue to a follow-up report called a Feasibility Study. 

          The Remedial Investigation says there are 15 Combined Sewer System outfalls discharging directly to the Anacostia River during storm events because of the capacity problems at the wastewater treatment plant.  In July through September of 2017 there were a total of 153 releases from these outfalls with a volume of 390 million gallons.  Sediment samples from one of the outfalls showed high level of PCB and PAH contamination.  And those are the combined sewers. There are 60 outfalls of just storm water entering the Anacostia River. The report sites all of these outfalls as a source of “urban” background contamination, resulting in the entry of PAHs, PCBs, pesticides and even some metals into the river.

          The Feasibility Study will report on manhole sampling for the combined sewer outfalls and the storm water outfalls.  These samples should provide some very interesting data on what portion of the contamination in the Anacostia River is caused as a result of urban living.  The report will be one of the few studies to examine urban contamination’s contribution to the degradation of our streams and rivers.  The EPA has been aware of the problem for years and published its first guidance way back in September of 2002 on how to establish urban background contamination when examining Superfund sites.  EPA’s regional office in the southeast and the EPA’s Office of Research and Development are currently engaged in a study to determine urban background contamination in southeastern cities.  I will be posting in the future on the results of these studies which essentially will tell us how modern living is impacting our natural resources.          

Biogeochemistry of Nutrient Pollution

Yuck!

I have used the term biogeochemistry in several blog posts on nutrient pollution and have been asked to explain what this term means and what role biogeochemistry plays in nutrient pollution. Biogeochemistry is a mouth full, but if you dissect the word then you see that there are two prefixes attached to the noun chemistry – bio and geo. Bio is short for biology and geo for geology. Biochemistry refers to the chemical processes taking place within living things, for example the incorporation of nitrogen into a plant’s proteins and chlorophyll. Geochemistry on the other hand is the study of the chemistry of geological processes, such as, the behavior of nitrogen in water and soils. So biogeochemistry is the combination of the two.


To explain further, let’s follow through with the example of the biogeochemistry of nitrogen pollution. Did you know earth’s atmosphere is 78 % nitrogen? That’s good right? After all, living organisms on earth need nitrogen for use in daily metabolic functions. But plants including algae can’t directly use the nitrogen in the air. It’s kind of like that old maxim about the ocean – “water, water everywhere but not a drop to drink.” Nitrogen gas has to be converted into ammonia or nitrate in order for plants to be able to use it. Nitrogen fixation and nitrification are the primary processes of conversion.


Nitrogen fixation produces ammonia. The chief nitrogen fixers on the planet used to be bacteria. But of course now humans have gotten into the game. Nitrogen fixation occurs as a result of fossil fuels being burned in power plants and during combustion in car engines. The process called nitrification converts ammonia to nitrite and then on to nitrate. Nitrification is pretty much just carried out by single cell organisms like bacteria. Both nitrogen fixation and nitrification require oxygen.


These biogeochemical processes occur both in soils and in water. So in water bodies like lakes, rivers, estuaries and oceans, bacteria are busy converting unusable nitrogen into usable forms, which algae – just like terrestrial plants – can use to grow. There’s also another process called denitrification which is going on in soils and water that are oxygen deficient. A group of bacteria which prefer oxygenless environments are busy taking nitrate and converting it back to unusable nitrogen gas. The nitrogen gas formed by denitrification is then cycled back into soils and water where it is once again used in the nitrogen fixation and nitrification process. It’s just one perpetual do-loop and is called the “nitrogen cycle” by scientists.


Of course the algae require other nutrients like phosphorous to grow and they depend on sunlight for photosynthesis, but in coastal waters and estuaries, the growth of algae is only limited by the availability of nitrogen. This is because these little algae guys need 16 times more nitrogen than phosphorous to grow and ocean waters are low in biologically usable nitrogen compared to phosphorous. It’s the exact opposite for freshwater lakes and streams.  In general if you add a bunch of man-made forms of nitrogen from fossil fuel combustion, nitrogen fertilizers, farm animal manure, and human waste (from wastewater treatment plants) to estuarine and coastal waters then algae are going to thrive.


However there are all sorts of other biogeochemical interactions that can come into play which affect the availability of nitrogen compounds to algae in the water. Take phosphorous, it readily adsorbs onto sediments under normal oxygen conditions and is then not available to the algae floating around in the water. In this case, adding nitrogen to the water won’t result in excessive algae growth. However if a water body is lacking in oxygen then sediments will release adsorbed phosphorous back into the water. This is because adsorption of phosphorous in sediments is strongly dependent on the presence of iron – oxidized iron. Iron forms sulfide compounds in water bodies without oxygen. Phosphorous does not interact in the same way with iron sulfides in sediments as it does with iron oxides. Therefore in low oxygen zones, phosphorous is more available in the water to help algae prosper when there are sources of nitrogen pollution.


Iron is also needed by algae for photosynthesis. Iron is not very soluble in water so it has to combine with organic matter to be available to aquatic organisms. The amount of organic matter in low oxygen waters is higher than it is in water with normal oxygen levels, because well, a lot of things are dying down there in the no oxygen zone since most aquatic organisms need oxygen to survive. Increased iron is then available in the water to help algae grow.


Complicated right? And I haven’t even touched on the issue of silica and how it impacts the type of algae growing in a water body. The diversity of biogeochemical interactions within a water body is the reason why each one must be studied independently to determine how best to prevent nutrient pollution.

Georgia Coastal Pollution

The world lies east: how ample, the marsh and the sea and the sky!

A league and a league of marsh-grass, waist-high, broad in the blade,

Green, and all of a height, and unflecked with a light or a shade,

Stretch leisurely off, in a pleasant plain,

To the terminal blue of the main.

Oh, what is abroad in the marsh and the terminal sea?

Somehow my soul seems suddenly free

From the weighing of fate and the sad discussion of sin,

By the length and the breadth and the sweep of the marshes of Glynn.

– Sidney Lanier

Marshland in Georgia


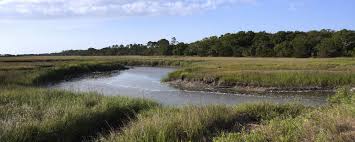
Georgia has the largest extant marshland along the entire Atlantic coast. Except for the intrusion of Interstate 95 and the growth of the cities of Savannah and Brunswick, the landscape has changed little since Sidney Lanier wrote his poem about the Marshes of Glynn in Georgia during the 1800’s. The reason for the wetland preservation is the forward thinking people of the state of Georgia who back in 1970 supported and passed a law protecting the coastal marshes of Georgia (Georgia Coastal Marshlands Protection Act.) Georgia has around 370,000 acres of estuarine tidal marsh bordering its 100 mile coastline. The state has also protected most of the barrier islands along the coast and they are primarily state and federal parkland. With such little development one might expect nearly pristine water quality off the coast of Georgia. One would be wrong.

Five major rivers flow through the coastal region of Georgia and empty into the Atlantic Ocean – the Savannah, the Ogeechee, the Altamaha, the Satilla, and the St. Mary’s Rivers.  The Satilla and St. Mary’s River are blackwater rivers. Blackwater rivers are named for the color of their water which is a dark tea brown to black. The color results from the decay of the abundant vegetation in the marshes through which the rivers flow. The water in blackwater rivers is usually more acidic than rivers with clear water and it may also have lower dissolved oxygen because of the vegetative decay. The watersheds of all five rivers are large and encompass not only the salt and freshwater marshes along the coast but the upstream woodlands, agricultural lands, and small cities and towns which dot the region. Forests and wetlands are the primary land cover in these watersheds. Farms only make up 8 percent of the land use. The widely dispersed population centers cover 7 percent of the land.

In spite of the near perfect ecological conditions along Georgia’s coast, each of the rivers has impaired water quality. Impaired water quality means that the water in a certain stretch of the river does not meet the pollution standards for the water’s designated use, like fishing or swimming. The Georgia Environmental Protection Division issued a Surface Water Quality Resource Assessment in 2017 which identified 413 miles of impaired waters in the 5 coastal watersheds and impairment of two inlets where the rivers meet the ocean. The major cause of impairment is low dissolved oxygen, which is problematic for aquatic organisms like fish since they (like us) need oxygen to survive. The second cause of impairment is fecal coliform. Fecal coliform is a bacteria produced in the intestines of humans, other mammals, and birds and is discharged with their poo.

If you were a water scientist, you would immediately suspect – based on the fecal coliform levels in the surface water of the rivers – there might be a gigantic wastewater treatment problem in the towns and cities within the watershed. But no, the Coastal Georgia Regional Water Plan issued in June 2017 identified Bryan County wastewater treatment plants as the only ones in the entire area needing upgrades to meet water quality. The main contributors to water pollution, according to both The Surface Water Quality Resource Assessment and the Coastal Georgia Regional Water Plan, are non point sources like urban development in the small towns and cities within the watersheds, agriculture which consists primarily of livestock operations in the upland areas, and silviculture (a fancy name for tree farm operations). Widespread use of septic systems in this rural environment is also probably a major contributor to surface water degradation.

Blame for some of the dissolved oxygen problems also can be laid on the nutrients – nitrogen and phosphorous, but the lack of widespread dead zones such as the ones in the Gulf of Mexico caused by fertilizer runoff into the Mississippi River and the ones in the Chesapeake Bay caused by fertilizer run-off and overdevelopment in the watershed don’t exist off the coast of Georgia. Nutrients cause algae blooms. The algae die and their decay depletes the water of oxygen. The lack of widespread nutrient related dead zones off the coast of Georgia can be attributed to the lack of development and limited agricultural operations, but also to the existence of abundant marshlands. All wetlands remove nutrients from water. This has been documented in a number of scientific studies over the last thirty years. The soils in wetlands are called hydric soils because they are saturated. These types of soils are full of organic matter from all the decaying wetland vegetation. Denitrifying microbes love these soils and provide a substantial removal system which locks up the nitrogen and keeps it from flowing out of the wetland. The marsh plants also like the excess nutrients because it helps them to grow, so they suck up as much of it as they can get. Waters leaving a marsh are substantially cleaner than those which entered, so much so, that environmental scientists often construct artificial wetlands just to treat nutrients. Georgia’s preservation of their coastal wetlands has helped save them from the nightmare conditions which other aquatic environments are undergoing.

The Coastal Georgia Regional Water Plan is part of another forward thinking effort by the Georgia state government to engage in state wide water planning efforts to sustainably manage water resources throughout the state. State wide water planning began in 2009 and the first coastal plan was issued in 2011. The 2017 plan is an update. The goal of water planning on the Georgia Coast is to meet water demands while protecting ecosystems dependent on clean water such as Georgia’s significant offshore commercial and recreational fisheries.

The Coastal Regional Water Plan recognizes the sources of contamination and the impairments identified in the 2017 Surface Water Assessment and has established specific actions to be taken to reduce pollution including replacing and upgrading the wastewater treatment plants in Bryan County or moving their discharge locations. Also identified in the plan is a monitoring program to determine the sources of the persistent fecal coliform contamination, establishment of best management practices for stormwater runoff such as retention ponds and erosion controls, providing silviculture operations with incentives for restoring wetlands, and supporting implementation of agricultural runoff controls such as manure management, conservation tillage, and planting of cover crops.

Most actions under the plan are anticipated to be implemented by the year 2025. Little future development is anticipated along the coast because of the protections the state of Georgia has provided for their marshlands. These protections will limit the surface water degradation which is found in other states like Louisiana ( https://waterblogger.org/water-quality/gulf-of-mexico-pollution/) and Maryland (https://waterblogger.org/water-quality/chesapeake-bay-pollution/ ) where wetlands have been destroyed and as a consequence there has been serious water degradation from nutrient pollution.

This is the fourth blog post in a series concerning nutrient pollution.

Gulf of Mexico Pollution

Can you imagine an area of pollution in the ocean which is the size of the state of New Jersey and where no marine life can live because there is too little oxygen in the water? You would think if such a place existed then it would be featured on the nightly television news and be in the newspapers on a regular basis. After all journalists flocked to the Gulf of Mexico when the oil spill from the Deep Water Horizon occurred in 2011 and it was reported in the media on a daily basis. But indeed such a large polluted area in the ocean does exist and it is located off the coast of Louisiana in the Gulf of Mexico. Perhaps journalists ignore its’ existence because there aren’t dramatic photos to show on the television like flowing oil from a borehole on the ocean floor or multiple oiled seabirds. In fact if you sailed right through this huge polluted zone on a boat, you would not even notice it, unless of course you tried to catch a fish.


The lack of oxygen in this area of the Gulf of Mexico is caused by “nutrient” pollution. Essentially water flowing down the Mississippi River is full of sediment, phosphorous, and nitrogen washed off the abundant farmlands in the central part of the United States. Phosphorous and nitrogen are called nutrients because they are used by living things for growth and metabolic functions. When all those nutrients in the freshwater river flow into the salty waters of the Gulf of Mexico, two things happen. Number one, the freshwater forms a lighter layer on top of the heavier salty water in the near shore environment of the Gulf. Number two, all those nutrients in the freshwater feed the algae living at the Gulf’s surface where the sunlight is abundant. This causes the growth of massive algal blooms. When the algae eventually die, they drop to the salty bottom layer of water. The decay of the algae uses up the oxygen in the bottom salty layer of water and produces a hypoxic or dead zone. (For more information on nutrient pollution follow this link https://waterblogger.org/water-quality/nutrient-pollution/ ).


Scientists have been measuring the extent of the dead zone in the Gulf of Mexico for over thirty years. The size of the dead zone has gotten larger and larger and in 2017 it grew to be the largest size ever – 8776 square miles. You are probably thinking, why isn’t someone doing something about this huge dead zone in the Gulf of Mexico, like the U.S. Environmental Protection Agency (EPA), isn’t that their job? Yes it is, and the agency does have the regulatory tools under the Clean Water Act to require waters of the United States to meet Water Quality Standards. But so far, and despite recommendations to EPA in 2007 by the National Academy of Science for the agency to use their regulatory tools, the EPA instead has decided to improve water quality in the Gulf through the use of a voluntary watershed effort among the states with drainages entering the Mississippi River. A Hypoxia Task Force was established in 1997 which includes several federal agencies and the states of Iowa, Illinois, Minnesota, Wisconsin, Kentucky, Tennessee, Arkansas, Ohio, Missouri, Mississippi and Louisiana. This may seem like a lot of states, but in reality, it is not even all the states which have drainage into the Mississippi River, after all the entire Mississippi River basin covers 1,245,000 square miles – 41 percent of the lower 48 states of the United States. However, the states involved in the Task Force are the biggest contributors of nutrients to the river.


The Hypoxia Task Force regularly reports on progress being made to reduce nutrient pollution. The Task Force set itself a goal of reducing the hypoxic zone in the Gulf to less than 3100 square miles by the year 2035. In order to reduce the hypoxic zone to this size, the amount of nutrients entering the Gulf of Mexico must be reduced by 45 % from the average amount of nutrients measured between1980 and1996.  An interim reduction goal of 20 % has been set for the year 2025, just seven years from now. The Task Force is relying on individual state strategies to achieve these nutrient reductions. At this point all states involved with the Hypoxia Task Force have drafted or completed strategies. Each state has set very different methodologies and plans for achieving nutrient reduction goals. Other than some targeted improvements to reduce nutrients from wastewater treatment plants, most of the actions in the state strategies are voluntary.


The Hypoxia Task Force knows where most of the nutrient pollution is coming from, after all this problem has been studied for a long time. The U.S. Geological Survey (USGS) has been able with the help of the Natural Resource Conversation Service (NRCS) to define where the greatest amount of nutrient pollution is coming from in the Mississippi River Basin. Below is a map showing the main sources of nutrient pollution to the Gulf. The map was put together by the USGS for the EPA’s 2017 Biennial Report to Congress.

Nutrient Sources to the Mississippi River from the EPA 2017 Report to Congress

As you can see from the map, the states with the greatest nutrient contributions to the Gulf are in the northern basin of the Mississippi River. So states like Minnesota, Iowa, Illinois, Wisconsin and Indiana, which are all over a thousand miles from the Gulf of Mexico, are the biggest polluters. Most of the pollution is coming from agricultural lands. Some of the causes are over fertilization of crops, uncontrolled manure at farm animal operations, and even the growing of certain types of crops, such as soybeans, which can produce excess nitrate in the soil. According to EPA, there are numerous conservation methods identified by the Department of Agriculture which can vastly reduce these sources of pollution. Studies conducted by the NRCS on conservation practices already being implemented in the upper Mississippi River Basin show reductions of nutrients can be achieved in the order of 5 to 34 % for nitrogen and 1 – 10 % for phosphorous. The NRCS studies attribute these conservation practices within the whole Mississippi River Basin to an 18 % reduction in nitrogen and a 20 % reduction of phosphorus in the surface water entering the Gulf of Mexico.


With such large nutrient pollution reductions from existing conservation practices, one wonders exactly why the hypoxic zone in the Gulf is getting larger. There are a couple of reasons. Poor nutrient controls have been in place for multiple years. A lot of the old nutrients which washed off farmland years ago are now contained within the sediment of the streams and rivers forming the Mississippi River watershed. This sediment in the stream and river channels is a continuing source of nutrient pollution into the Gulf. Every time there’s a big storm or there’s lots of precipitation then sediments containing nutrients are scoured from the river and stream channels and washed further down the river toward the Gulf. Even if you were to eliminate all the nutrients in farm runoff from now into the future, there are still these legacy nutrients over which one has to worry.


I’m afraid we always tend to blame the farmers for all our nutrient pollution problems. Farmers are probably unfairly targeted to shoulder most of the nutrient reductions when many of the causes of the long term pollution problem in the Gulf are really a result of the over engineering and channelization of the Mississippi River to provide transportation and to reduce flooding. These activities have resulted in loss of streamside vegetation, including forests and wetlands that would have helped buffer the nutrient pollution. (Here’s a link to more reading on the problems of the Mississippi River https://waterblogger.org/water-quantity/dams-and-their-impacts-on-wetlands/  .) Scientists also blamed the increased size of the dead zone on the larger and more dispersed freshwater flow resulting from the channelization and diversion of the river into the Gulf through the lower portion of the Mississippi Delta because it has spread the nutrients and the stratification in the coastal waters over a much larger area then would have otherwise occurred.


So whatever pollution reduction methods are implemented by the states through their strategies, it is unlikely to produce immediate reductions in the size of the dead zone in the Gulf even by 2035. Unless of course other options like stream and river restoration activities are also incorporated into the Hypoxia Task Force’s plans.

Chesapeake Bay Pollution

The Chesapeake Bay is a large estuary on the Atlantic coast of the United States covering about 7000 square miles and splitting both the states of Maryland and Virginia in two. Estuaries are common in coastal areas where streams or rivers enter the ocean. The Chesapeake Bay is an unusually long estuary, stretching 206 miles from the border of Pennsylvania and Maryland to its confluence with the ocean near Norfolk, Virginia. The Susquehanna River which starts in New York State and flows through Pennsylvania is the Chesapeake Bay’s main tributary. In fact the Chesapeake Bay is actually the ancient valley of the Susquehanna River which after the last glacial epoch was flooded as the glaciers melted and sea level rose. A “drowned river valley” is what geomorphologist’s call landforms like the Chesapeake Bay. Other major tributaries to the Chesapeake Bay are the Patuxent, Rappahannock, Potomac, and James Rivers.


Similar to other coastal estuaries, the Chesapeake Bay is affected by the oceans tides and is therefore a mixture of salt and fresh water, with the freshwater coming from the upland tributaries and the saline water from the ocean. The closer you get to the mouth of the Bay near Norfolk, the saltier the water gets. However, the connection between the Chesapeake Bay and the ocean is a narrow and confined one, which makes the tides in the Bay more like the Lazy River ride at the water park rather than the aggressive water slide estuaries of the San Francisco Bay or Puget Sound. Tides range from 1 to 3 feet on the Chesapeake Bay while the San Francisco Bay can range up to nearly 6 feet and the Puget Sound as much as 8 feet.


The Chesapeake Bay’s pollution problems started the day that the first European settlers stepped off the boat on Clement Island Maryland in 1634 and started clearing land, planting crops, and raising animals. The big three pollutants in the Chesapeake Bay are phosphorous, nitrogen, and sediment. Phosphorous and nitrogen are nutrients and their main sources in the Bay watershed are agricultural crops, manure from livestock operations, urban storm water, wastewater treatment plants, and atmospheric deposition from the burning of fossil fuels in power plants and motorized vehicles. Sediment of course as everyone knows comes from erosion and the chief causes of erosion in the Chesapeake Bay watershed are – agricultural practices and urban development. The fact that the Chesapeake Bay is essentially a bathtub and sediment along with nutrients settle out at the bottom, instead of flushing out to the ocean like the pollutants do in other estuaries, is one of the chief causes of the continuing eutrophication of large parts of the Bay (to learn more about nutrients and eutrophication read my post on the subject at this link  https://waterblogger.org/water-quality/nutrient-pollution/)


Eutrophication is pretty much the result of the huge algal blooms caused by excess nutrients in the Bay waters. The death and decay of algae uses up dissolved oxygen in the water. Since aquatic organisms like fish, crabs, clams, worms and so forth need oxygen to breath, they pretty much avoid these “dead zones” of oxygen less water in the Bay. The nutrients at the bottom of the Bay and the regular flushing of nutrients from soil and paved surfaces into the Bay during rain events serve as a continuing source of nutrients for the algae.


The people who live in the Chesapeake Bay area have been trying to “Save the Bay” since 1983 when the Chesapeake Bay Program was established. The states of Maryland, Pennsylvania, Virginia and the District of Columbia were the first participants. To spread the joy, other jurisdictions in the Chesapeake Bay’s enormous watershed, covering over 64,000 square mile, were signed up in 2001 to help reduce the big three pollutants. The jurisdictions include Delaware, New York, and West Virginia.


You would think with all these States getting together and all the money being spent ($73 million in 2017 alone) that the Bay would be “Saved” by now. But no, there has been very little actual will to “Save the Bay”, although everyone does a lot of talking about it.  The U.S. Environmental Protection Agency (EPA) finally got fed up with the States after 25 years of restoration efforts and pollution reduction schemes resulted in no substantial improvement in the water quality in the Chesapeake Bay. The EPA decided to work with the 7 government jurisdictions to establish a Total Maximum Daily Load (TMDL) for the Chesapeake Bay. The TMDL was issued at the end of 2010. I have talked about TMDLs in this blog before, but briefly for new readers: TMDLs are set for waters of the United States that are considered “impaired”. State governments are required under the Clean Water Act to report impaired waters in their jurisdiction and establish TMDLs that will restore the water for its designated use, such as swimming, fishing, or drinking.


The TMDL limits the amount of nitrogen, phosphorous and sediment each state can contribute to the Chesapeake Bay. Below are the actual allocation numbers designated in millions of pounds per year per state.


Jurisdiction Nitrogen Phosphorous Sediment
       
Pennsylvania 73.93 2.93 1,983.78
Maryland 39.09 2.72 1,218.10
Virginia 53.42 5.36 2,578.90
District of Columbia 2.32 0.12 11.16
New York 8.77 0.57 292.96
Delaware 2.95 0.26 57.82
West Virginia 5.45 0.59 310.88
TOTAL 185. 93 12.54 6,453.61

Source: Chesapeake Bay Total Maximum Daily Load, U.S Environmental Protection Agency, December 29, 2010


These limits reduce the total current contribution of the big three pollutants by 25% for nitrogen, 24% for phosphorous and 20% for sediment.  The total is the maximum amount of the three pollutants that the Bay can receive and still meet Water Quality Standards for dissolved oxygen, water clarity, submerged vegetation, and chlorophyll a (chlorophyll a is a measurement means of determining how much algae is in the water).


In order to meet these goals each State had to submit to EPA a Watershed Implementation Plan showing what projects would be undertaken to meet their limits. As part of each state plan there are short and long term milestones that must be met. The goal is to meet Water Quality Standards in the Bay by 2025. Well that’s not exactly correct. In reality and according to the scientist’s models, the Chesapeake Bay will only theoretically meet Water Quality Standards by 2025. The scientists studying and working to “Save the Bay” often refer to a “lag time” for achieving Water Quality Standards which is a result of the legacy pollutants built up in the Bay and all of its tributaries, and which will continue to contribute to poor water quality even after the limits for the big 3 pollutants are met in 2025.


By setting the TMDL, the EPA essentially drives the Chesapeake Bay Program now. There are short term milestones to be achieved every 2 years in order to show incremental progress in restoring the Bay. These short-term milestones are primarily agricultural management improvements to reduce pollution, because it is the easiest way of achieving progress. There is a good bit of money available through the Department of Agriculture to assist farmers in conservation efforts. These agricultural management strategies target alternative and cover crops, tillage practices, manure waste management, water control structures, pasture management, etc. Other easy short term targets are restoration of wetlands, planting of stream side (riparian) vegetation like trees, and reductions in the atmospheric deposition of nitrogen since nitrogen is regulated under the Clean Air Act causing the amount of nitrogen in the atmosphere from fossil fuel combustion to slowly decrease over the years.


To see if the TMDL and the long range milestones in the Watershed Implementation Plans would restore the Bay by 2025 as envisioned, the EPA decided to ask the National Research Council (NRC) to assess whether their new plan to “Save the Bay” would achieve its goals and objectives. It was the first real outside assessment of the Bay Program other than a nasty General Accounting Office assessment in 2005. The NRC published a great big report on the subject in 2011, entitled “Achieving Nutrient and Sediment Reduction Goals in the Chesapeake Bay.”


It is an amazing report, full of interesting statistics. For example did you know that 17 million people live in the Chesapeake Bay watershed? That’s a lot of people. But those people are widely dispersed, except for urban centers like Washington, D.C. and Baltimore. Only 7 % of the land in the watershed is urban and amazingly only 22 % is agricultural land. The rest is wooded and open space. But the report brings up the worrisome nature of the continued urban growth within the watershed.


According to the NRC, there has been significant success in decreasing nutrients from municipal waste water treatment plants in urban centers. Permit requirements were put in place back in 2005 which resulted in massive upgrades to nutrient removal systems in the wastewater treatment works of cities and towns within the Chesapeake Bay watershed. The NRC cites statistics that as of 2009, 78% of wastewater treatment plants had achieved 78 % of the reduction goals for nitrogen and 99 % of the phosphorous goals set by EPA to improve water quality in the Bay. But as the NRC points out, as population in the watershed grows, there will simply be more wastewater to treat, and more effluent released into the rivers to flow down to the Bay.


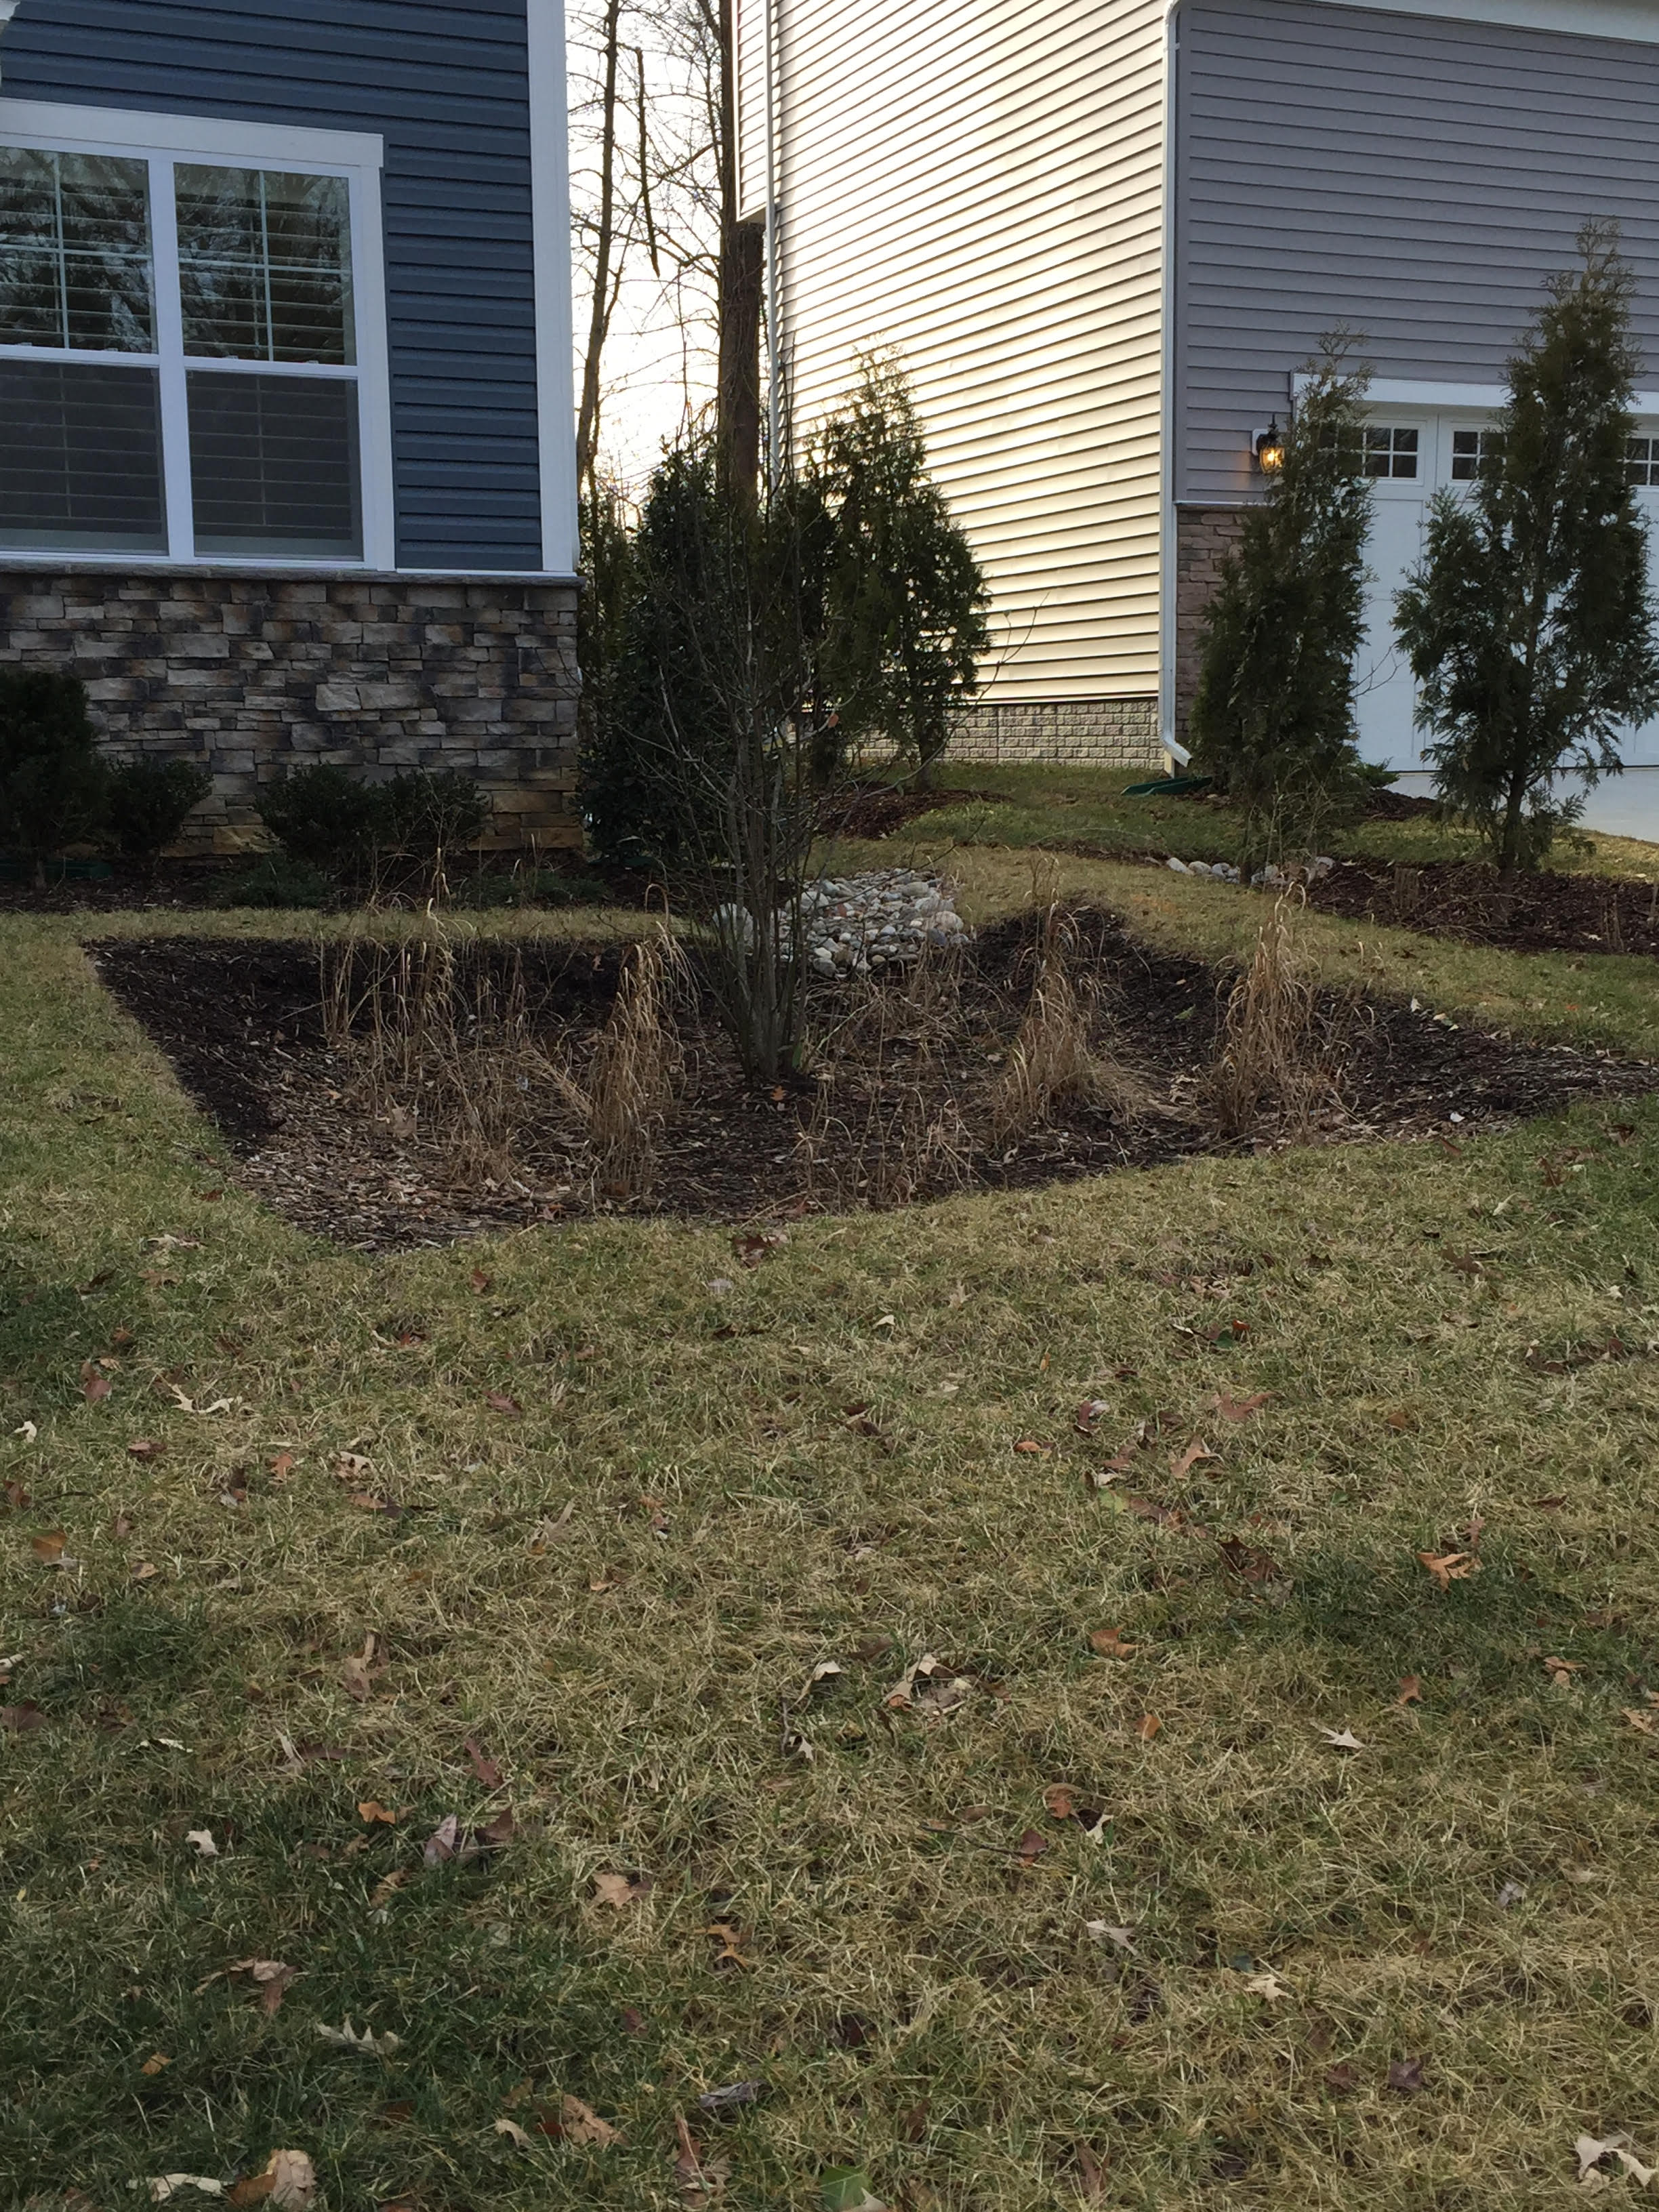
The NRC report outlines major concerns with storm water reduction goals for urban areas. Storm water is the water that runs off of streets and yards into either a storm water collection system or directly into water ways. The report says the limits set for reduction of pollutants from storm water will be the most difficult to achieve because of the high costs and the low removal rates of technologies used to decrease the big 3 pollutants. The NRC questions the ability to achieve the storm water pollution reduction goals due to the rapid rate of population growth and development in the Chesapeake Bay’s watershed. What sort of technologies is the NRC referring to for storm water management? They are talking about rain gardens, use of pervious materials instead of asphalt and concrete, use of narrower streets, and sunken medians. These technologies can all be achieved through regulation for new development, but it will be hard to get existing development to implement them because of the expense. The NRC says they are costly and inefficient because they rely on their widespread use across a landscape to remove pollution from many small sources.


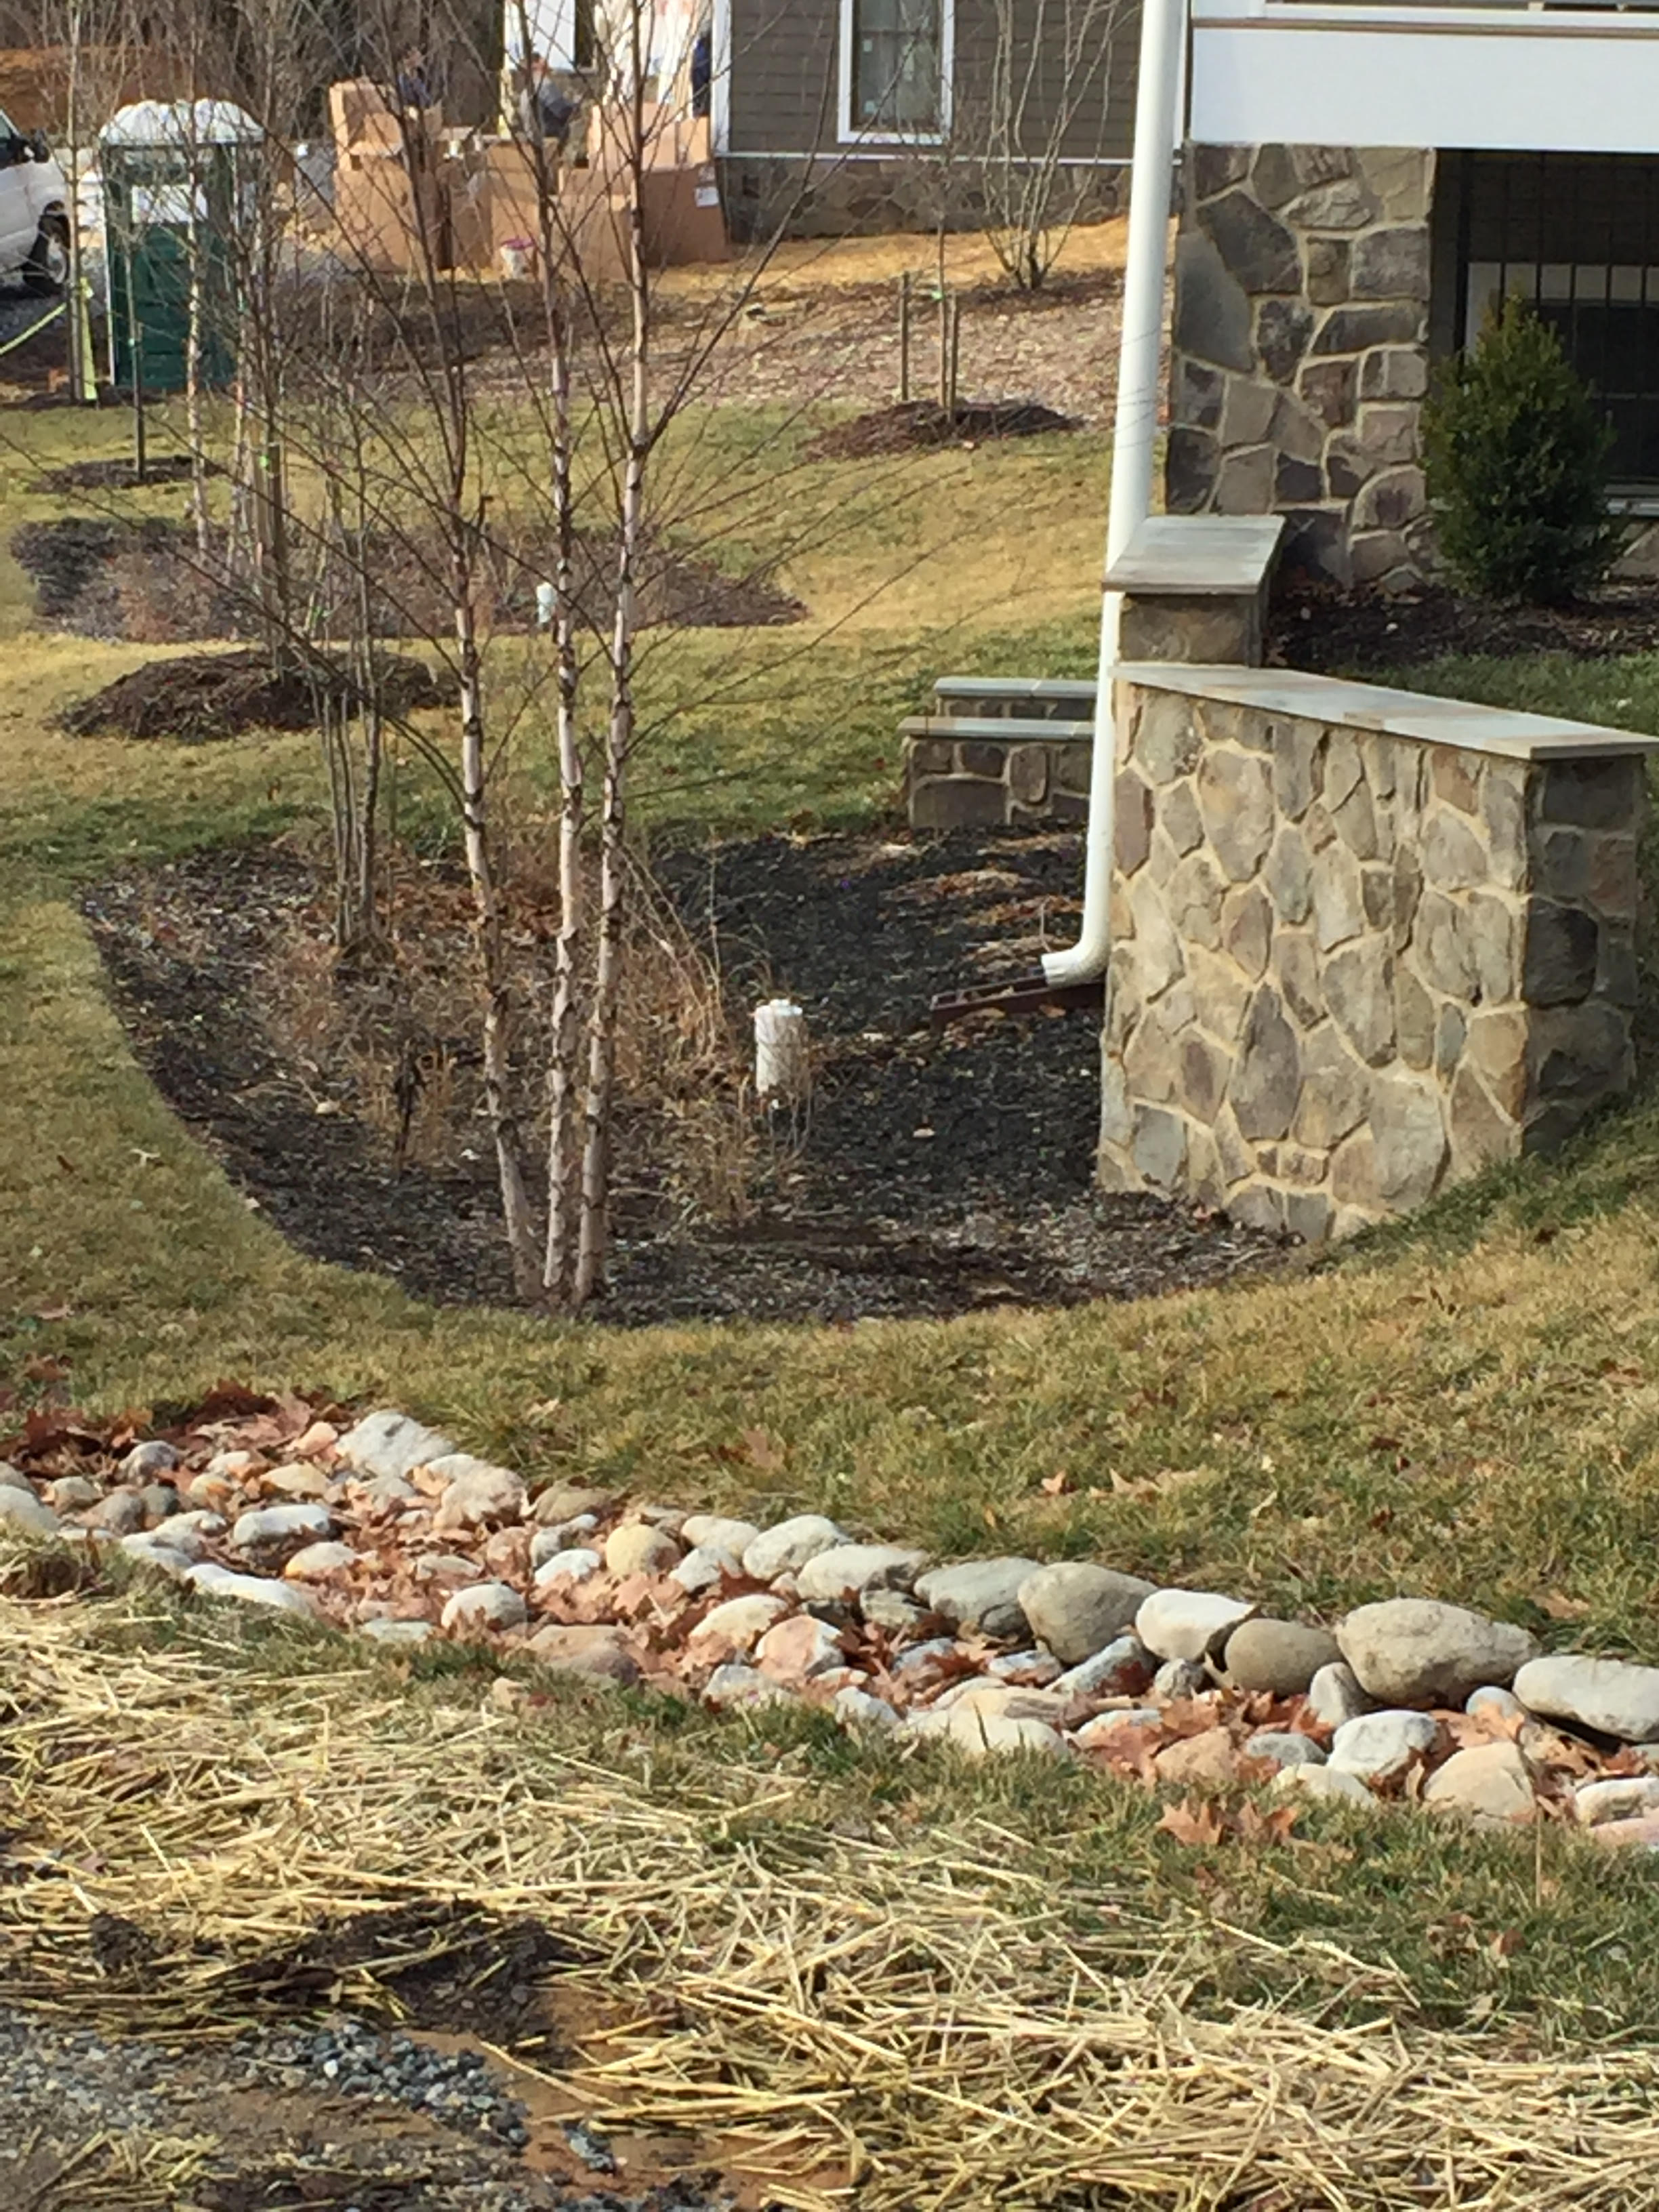
What do they look like? Here’s pictures of some rain gardens installed in new development. This is on a large piece of property where there was only one house, but zoning authorities allowed it to be torn down and 5 houses built in its place as long as they installed rain gardens.

I know you are laughing. This is supposed to “Save the Bay”? And how long do you think these are going to stay in place before the homeowners see them as a safety issue for children playing in the yard? That is the other problem with these types of features – maintaining them.


The other source of pollution that the NRC says will be difficult to reduce is the nutrient pollution from septic tanks. The NRC report states that between 1990 and 2000, the watershed population increased by 8 % but the land converted to development more than doubled. Much of this development is what you often hear referred to as “suburban sprawl” and many of the areas where it has occurred do not have access to urban wastewater treatment systems. NRC says 25 % of the housing in the Chesapeake Bay watershed is served by septic tanks which produce 33 million pounds of nitrogen every year. Most of that nitrogen ends up in the groundwater and is slowly transported through groundwater flow into surface water bodies and down to the Bay. The amount of time (sometimes decades) groundwater takes to reach the Bay is another lag time issue that scientists have pointed out in discussions about meeting Water Quality Standards by 2025. These days, very efficient nitrogen removal septic systems are available, but even if everyone installed one at their house, there is still all the legacy nitrogen in the groundwater from the old systems which is slowly flowing like a ticking time bomb toward the tributaries of the Bay. But of course not everyone is going to install super efficient septic systems because they are extremely costly. Many States plan on transitioning all these homes to centralized wastewater systems – another expensive endeavor.


The NRC says the population within the Chesapeake Bay watershed is estimated to reach 19 million people by 2030. Based on the current land development rate, the amount of developed land could increase by 60 %. Impervious surfaces cover 18 % of all lands in the watershed now and, according to the NRC, stream water quality is impaired when impervious surfaces in a watershed cover 5 to 6 % of the land.


So it has been seven years since the TMDL for the Bay was established and there are only eight more years in front of us until the Bay must meet Water Quality Standards. How do you think the restoration effort is going? Well it is easy to find out. The EPA produces a report every year titled: The Bay Barometer. The 2017 report is not available yet, so I took a look at the 2016 Bay Barometer. There’s some good news in the report. The number of acres of submerged grasses has greatly increased through restoration efforts. These underwater grasses are critical in providing food and shelter to aquatic animals. They also produce dissolved oxygen and absorb nutrient pollution. The Bay Program’s goal is to restore 185,000 acres by 2025 and already half of that has been achieved. Eighty two percent of a targeted 2500 miles of stream has been opened to migrating fish by removing dams and culverts.  Blue crabs are back in the Bay in great numbers as a result of crab harvesting restrictions. The goal was 215 million adult females by 2025 and already 90% of that number has been reached. Unfortunately that is about it on the success level. Planting trees along streams is way down; only 9 % of the wetlands targeted for restoration have been achieved; and only 50% of the land targeted for conservation has been protected.


There have been some improvements in water quality. Thirty seven percent of the Chesapeake Bay and its tidal tributaries met Water Quality Standards for dissolved oxygen, chlorophyll a, and clarity. That’s a 10 % increase over the previous reporting period, but it is far below the 100 % expected by 2025.


As for the big three pollutants, there was a 25 % reduction in nitrogen, a 44 % reduction in phosphorous, and a 59 % reduction in sediment from the previous year. Unfortunately again and according to The Bay Barometer, the reductions are due to the volume of river flow, which leads to the sad sorry fact that nitrogen, phosphorous and sediment levels are the highest during years of high rain when the rivers and streams are pouring water into the Bay and that the pollutants levels are lowest during dry years when the volumes are far less. The highest amount of nitrogen, phosphorous and sediment recorded in the last 10 years was in 2011 after Tropical Storm Lee.


The Chesapeake Bay Program is a good endeavor, even if its successes so far have not been great. At least the whole Bay is not completely lacking in dissolved oxygen. If things had continued as they were, the Bay would probably be in much worse shape than it is now. The best analogy for the Chesapeake Bay’s pollution problems might be the nursery rhyme of Humpty Dumpty who sat on a wall from where he had a great fall; then all the king’s horses and all the king’s men never could put Humpty back together again. The Humpty Dumpty Bay will continue as long as overdevelopment occurs in the Bay’s watershed. Development has broken the natural processes that once kept the Bay a healthy ecosystem. Government officials, scientists and non-governmental institutions are working hard to “Save the Bay”, but without restrictions on development, the task is like another analogy I can think of: Sisyphus pushing the ball up the hill in Hades.

Nutrient Pollution

My recent post on the Bloede Dam removal in Maryland prompted me to dwell a little bit on the nutrient pollution that continues to plague our water resources. Nutrients are the chief polluter of our river systems, lakes and coastal waters. It is such an old problem, but it just never gets resolved. When scientists talk about nutrient pollution, they are referring to phosphorous and nitrogen entering our waterways through surface run-off and groundwater discharge (referred to as “non-point sources”) and through direct discharges from wastewater treatment plants and other end of pipe sources (commonly called “point sources.”) Scientists are alarmed about the ever increasing amount of nutrients in our waters. So much so that a few years ago, the U.S. Environmental Protection Agency (EPA) commissioned a Nutrient Innovation Task Group composed of water managers and scientists from state governments, federal agencies and universities to define the problem. The Task Groups Report was issued in late 2009 and was actually entitled “An Urgent Call to Action.” It is a source of amazing statistics.


Just a refresher in case you don’t remember, but the problem with nutrients in our waterways is the resulting algal blooms. Scientists don’t call phosphorus and nitrogen nutrients for no reason. Both nitrogen and phosphorous are needed by living organisms for cell growth. This is why farmers spread it on their crops as fertilizer. It is why homeowners use it on their lawns. So when you have a lot of nutrients going into the water, it is like fertilizing the algae. Add sunshine and you get a bumper crop. Not really what anyone wants, because when the algae inevitably die off, the decay of their little dead algae corpses uses up the dissolved oxygen in the water through a process called eutrophication. Eutrophication produces “dead zones” or what scientists refer to as hypoxic zones. The quantity of floating algae (called phytoplankton) can increase so much that their mass actually blocks sunshine into deeper waters, depriving beneficial grasses and other vegetation that are to be found in the bottom of water bodies of the light they need for growth.


The Nutrient Innovation Task Group’s report states nutrient pollution along with the consequent overgrowth of algae and other nuisance aquatic plants as well as decreases in dissolved oxygen impairs 31% of assessed rivers and streams in the U.S., 30% of our lakes, and 50% of our bays and estuaries. The word “impairs” simply means that the function of the water resource is diminished. An example of an impaired water body would be an estuary which once supported a vital fishing industry but now has large “dead zones” where there is so little oxygen that fish can’t breathe and they have either died or vacated the area.


All of the excess nutrients entering our water bodies are from just a few sources, but they are large sources. Much of it comes from agricultural production. If there are no runoff controls on agricultural fields, excess fertilizer applied to crops can be washed into local streams. Manure from chicken and cows are also a big source of nitrogen and phosphorous to local waterways if not managed and controlled adequately. Urban storm water is another big source of nutrients as a result of all that lawn fertilizer we apply. Then there’s all the nitrogen and phosphorous coming out of wastewater treatment plants and septic systems. Humans in the U.S. produce about 18 million pounds of poop annually which is treated somewhat inadequately at our wastewater treatment plants. In 2009 when “An Urgent Call to Action” was published only 4% of the 16,500 wastewater treatment plants in the U.S. had limits for nitrogen in their permits and only 10% had limits for phosphorous. Then there are the 20% of homes in the U.S. which are on septic systems and are contributing nutrients to our surface waters via groundwater flow.


Oh wait a minute; I nearly forgot to mention another major source of nitrogen. It is from atmospheric deposition. When fossil fuels are burned in cars and power plants, it results in nitrogen oxides being emitted into the air. As they say, what goes up eventually comes down. And it comes down directly into our water resources or it is washed off our urban centers during storms and eventually makes its way into our waterways as well.


There are two well known, well studied water bodies where nutrients have caused major problems – the Gulf of Mexico and the Chesapeake Bay. The 2009 report cites that hypoxic zones cover 7900 square miles of the Gulf of Mexico and over 40% of the Chesapeake Bay. The report had a very interesting chart which I’m going to share here. It is the estimated sources of phosphorous and nitrogen going into these two water bodies.


Source: An Urgent Call to Action. Report of the State-EPA Nutrient Innovations Task Group. August 2009.

As you can see the source of most of the nutrients going into the Gulf of Mexico are from agricultural production, while nutrients going into the Chesapeake Bay are about equally split between agricultural production and urban sources.

Nutrient pollution is not a stagnant problem, because the population continues to grow. In the report by the EPA Nutrient Innovations Task Group, the chief cause cited for the escalation of nutrient pollution in water is the increase in the U.S. population. In addition, the report predicts the U.S. population will grow by 135 more million people by 2050, exacerbating the amount of nutrients flowing into our waters. The report written almost eight years ago now, states that current controls to reduce nutrient pollution of our water resources are totally inadequate. In response, the U.S. EPA and state environmental regulators developed a “Framework for State Nutrient Reductions” in 2011. The framework reflects a partnership effort to reduce nitrogen and phosphorous in U.S. waterways by prioritizing watersheds for reduction efforts and then setting actual goals such as strengthening permits for waste water treatment plants and other point sources, establishing strong programs to promote land stewardship practices for agricultural lands, and improving storm water management in urban areas.

As part of this effort states are being asked to establish numeric goals in priority watersheds for reduction of nutrients. When water scientists talk about the amount of nutrients entering a water body, they call it a load. So these efforts are aimed at reducing nutrient loads into water resources. EPA guidance in the past allowed for narrative or numerical criteria for establishing pollution concentrations below which a water body would be able to achieve its full designated use – such as commercial fishing or swimming. Narrative criteria have been mostly used by state water managers and have been rather useless in achieving improvements. Narrative criteria simply state what condition you want to achieve. Numerical criteria establish what nutrient loads must be imposed for both point sources and non-point sources entering a water body. As you can imagine numerical criteria are much harder to establish than a simple statement of what you’d like to achieve.


With the proposed framework and a call by EPA to provide numeric criteria as opposed to narrative criteria for attaining the water quality goals for a water body, I would expect to see some improvements over the last six years. After all as the old adage says, what gets measured gets done. So as a follow-up to this blog post, I will be examining over the next few months whether improvements have been achieved in the two largest hypoxic water systems in the U.S. – the Chesapeake Bay and the Gulf of Mexico.

Ocean Condition: Assessing the Fish

Questions, questions, there are always questions. The big question about my review of the Environmental Protection Agency’s (EPA) January 2016 “National Coastal Condition Assessment 2010” report was “how did the EPA determine the majority of coastal fish in the United States were in fair to poor condition?” My last blog post (if you didn’t catch it, here’s the link https://waterblogger.org/water-quality/ocean-condition/) said EPA rated the majority of fish in coastal waters as fair (26.4 % of fish) to poor (49 % of fish) due to the amount of selenium in the fish tissue. It is a fair question about what constitutes such a rating. So I went back to EPA’s technical report which provides all the methodologies for the data produced during the study. It was also released in January 2016, as a companion piece to the “National Coastal Condition Assessment 2010” report.

EPA has been using a standard process for examining toxicity in fish for the two decades they have been producing reports on coastal conditions. The method used examines the whole body tissue of a fish. When I used to work on ecological risk assessments, we referred to this method as the bassamatic. EPA of course refers to the process as homogenization. Basically you put the fish in a blender or other sort of grinder. I know this presents an unpleasant image, but it is important that your sample for analysis is going to represent what the wildlife out there is actually eating. My understanding is the fish are generally in a frozen state before they are blended and these are not your kitchen blenders anyway, as they typically have titanium blades to prevent laboratory contamination of the sample. Once the fish samples are prepared, they are tested for a number of natural contaminants, including selenium, mercury, cadmium, and arsenic. They are also analyzed for a number of persistent organic contaminates like the pesticides toxaphene, mirex, lindane, endrin, endosulfan, dieldren, DDT, and chlordane. They are also analyzed for other persistent organic contaminants hexachlorobenzene (a fungicide), heptachlorepoxide (a degradation compound of the pesticide heptachlor), and different molecular weight hydrocarbons. Persistent is “environment talk” for organic chemicals that don’t readily degrade and stick around causing endless problems. Fortunately most of these are no longer used in the United States.

Next EPA sorted through a multitude of scientific laboratory studies conducted to establish contaminant concentrations that pose risks to birds, mammals, and fish. There’s currently a huge body of scientific work in this area. EPA wrote the guidelines for conducting ecological risk assessments way back in the 1990s and scientists have been developing data on fatal and sub-lethal contaminant exposure to wildlife ever since. You know that old saying “Whatever kills you makes you stronger?” Well it is definitely not true in the world of toxic contaminants. Sub-lethal in the case of toxic contaminants can have a variety of very nasty consequences for wildlife. Here’s your word for today: teratogen. A teratogen halts or deforms the development of an embryo or fetus. This is a sub-lethal effect.

Environmental scientists don’t use the terms lethal and sub-lethal. They use the terms acute for lethal and chronic for sub-lethal. The concentration of a contaminant known to have a toxicological effect on a wildlife species is called the Toxicity Reference Value or TRV for short. Because nobody wants to have a toxicological effect on wildlife, scientists generally look at only the exposure concentrations that show no observed adverse effects (NOAEL) on wildlife or the low observed adverse effects (LOAEL) on wildlife.

For the national coastal study, EPA looked at a variety of wildlife that all eat fish and developed a generalized NOAEL and LOAEL for the contaminants analyzed. I’m going to use two of the contaminants for comparison: selenium and arsenic. Most people when they think of arsenic, they’re thinking poison, right? Well look at this:


Birds Marine Mammals Marine Fish


Selenium NOAEL 0.27 0.15 11.04
LOAEL 0.53 0.24 14.75


Arsenic NOAEL 3.39 0.08 0.06
LOAEL 8.51 0.4 0.3


The numbers you see are in milligrams per kilogram or parts per million (ppm). For a bird the low observed adverse effect of selenium is at 0.53 ppm, while the low observed adverse effect of arsenic is 8.51 ppm. Selenium has a more toxic effect on birds than arsenic does. Marine mammals also have a low TRV for both selenium and arsenic.

But remember now, EPA is examining the condition of the fish and what the toxic impacts are on the birds, mammals and fish that are eating them, not at what level a particular wildlife species starts having toxic effects. They had to calculate what amount of a contaminant in a fish would pose a risk to birds, marine mammals, and marine fish. So they got their fish tissue NOAEL and LOAEL for the toxic impacts by taking the TRV for wildlife species, multiplying it by the general body weight and dividing it by the general amount of fish ingested. Yes they really did this. I know it sounds complicated and frankly the whole process makes my head hurt, but they came up with some figures they could screen fish for and say whether they were in good, fair or poor condition.

Here are the selenium numbers EPA developed for their report:


Contaminant Bird Marine Mammal Marine Fish
Fish Tissue Fish Tissue Fish Tissue
NOAEL LOAEL NOAEL LOAEL NOAEL LOAEL
Selenium 0.29 0.57 259.68 428.48 11244.05 15016.72

These figures are again in milligrams per kilogram. Marine mammals like dolphins and seals and marine fish like tuna, shark and swordfish have larger body weights than birds so they can eat fish with a lot more selenium in them before they begin to have toxic effects. Birds also have a greater ingestion rate – they eat more just to keep their body weight up. I guess it takes more calories to fly than to swim around or walk.

So there you have it. EPA established their screening criteria for what constituted fair and poor fish quality based on the consumption of fish by birds.

Ocean Condition

For a while now, I have been writing about changes to the earth’s oceans as a result of climate change. I’ve felt adrift in the ocean environment, having primarily worked on terrestrial surface and groundwater issues. So I prepared to launch myself into a vast number of research papers on ocean water conditions to update myself on the current science. Fortunately for me, EPA’s “National Coastal Condition Assessment 2010” was published in January of 2016. The report, although issued somewhat tardily, is a great snapshot of coastal water conditions in the U.S. and saved me from months of reading dry, poorly written journal papers. I was able to shift with the wind and set sail on a short excursion of only 103 pages to find out the condition of coastal waters in the U.S. EPA defines coastal waters as the estuaries, bays, wetlands, swamps, and open waters along the coastlines of the U.S.


This is EPA’s third assessment of the ocean waters of the U.S. The first two assessments were conducted in 1999/2000 and 2005/2006. So now, there is a ten year history of coastal water condition assessments. You can do a lot with this kind of data. You can see what the trends in water quality are. Is water improving or getting worse? If so why is that happening? And if it is getting worse, what further water programs do we need in the U.S. to stop coastal water degradation. After all it’s the activities here on terra firma that are affecting our coastal waters. We all learned rivers drain into oceans years ago in elementary school. Everything we do here on the ground eventually ends up in the ocean. Our wastewater treatment plants dump the treated sewage water back into our rivers, which then flow into the oceans. Our agricultural runoff and city storm water drainage all end up in the river and flow down to the sea.


EPA measured the condition of coastal waters using four different methods. First they looked at the health of biological communities living in coastal waters. Specifically they collected and counted the number of benthic organisms. Benthic organisms are the creepy crawlies hanging out in the sediment at the water’s bottom. You know these guys – worms, clams, that sort of thing. If they exist in large quantities then you have good coastal water conditions; ditto for surface water too. If you go into a stream and turn over a few rocks and don’t find some creepy crawlies underneath them, you probably have water quality problems. The existence of benthic organisms is an important indicator of the overall health of any water body.


Second they looked at the water quality itself and they used all those parameters which are used on terrestrial surface waters to determine if they are in good condition – nitrogen, phosphate, dissolved oxygen, water clarity – and additionally something called chlorophyll a. Chlorophyll a is the stuff that makes plants green. If you have a lot of chlorophyll a in coastal waters, it’s because you have a lot of algae. Too much algae means too many nutrients. It also means you probably have low dissolved oxygen at the bottom of the water where dead algae accumulate and start to “stank”.


The EPA also looked at sediment quality in their report. They had two measures for determining sediment quality: sediment contaminants and sediment toxicity. You’d think if you had the one, you’d have the other right? Well it doesn’t necessarily work that way. You can have low amounts of contaminants, but if you have contaminants the creepy crawlies really don’t like (especially in the fatal range of don’t like) that’s all it takes to end up with poor sediment quality. EPA collected sediment samples from the bottom of coastal waters and sent them to laboratories to be analyzed for metals, polyaromatic hydrocarbons (PAH), polychlorinated biphenyls (PCBs), organochlorine pesticides, and total organic carbon. The results are EPA’s measure of sediment contaminants in coastal waters. EPA also took the sediment and put it in a tank with ocean water in the laboratory. They then threw into the tank some different kinds of amphipods to see how they fared. Amphipods are these nearly microscopic creatures that look like shrimp but aren’t. They are scavengers which means they grub around in the sediment looking for dead things to eat. Basically the amphipods hang out for about 10 days in the tank. Some of their friends and family are put into another tank in the laboratory with nice clean sediment (this tank of amphipods is called the control.) After the 10 days, scientist count how many amphipods are left in the tank with the contaminated sediment and in the control tank. There are measurement standards for this sort of thing and the scientists can calculate based on the mortality rate of amphipods what the sediment’s toxicity is.


For its fourth and final measure of coastal water conditions, EPA analyzed fish tissue for contaminants. Not for the level of contaminants that are of concern to humans who eat fish, but for the level of contaminants of concern for wildlife that eat fish.  Humans eat fish just a few times a week, if at all.  Wildlife like otters, osprey, minks, and herons are eating fish all day long, every day of the year. Fish are their main food source.


EPA’s report covers the total coastline of the U.S., including the Great Lakes. Unfortunately this is the first year the Great Lakes were included in the study, so I’m excluding the Great Lakes’ data from this post, because there is really nothing to which the current condition of the coastal waters of the Great Lakes can be compared. For their report, EPA has divided the coastline into the Northeast Coast (from Maine to Virginia), the Southeast Coast (North Carolina to Biscayne Bay in Florida), the Gulf Coast (west coast of Florida all the way to the border of Texas with Mexico), and the West Coast which includes Washington, Oregon and California. That’s a lot of coast line; 35,400 square miles to be precise. And only 1,104 sites were sampled. When I saw that low number, I gave the whole study a wary eye. How could data from such a small number of sites adequately reflect coastal condition? Here’s how EPA does it: a statistical method is used which is similar to those used in political surveys. This kind of sampling methodology provides a statistically valid estimate with a known confidence level. Coastal sites can’t just not answer their phone, right? So such a survey should be even more precise than a political poll. Well not exactly. Unfortunately there is a lot of missing data, where scientists went out and tried to catch a fish at a particular study site, but couldn’t get one. Or a scientist couldn’t collect a sediment sample at a site because the site location was on a rocky coast. It depends on the coastline as to how much data is missing. EPA is working on improvements in data collection for their current 2015 report. But even with missing data there are still some clear trends, especially if you look at the individual coasts.


For example along the Northeast Coast only about 44% of waters were rated as having good quality, mainly because of the amount of phosphorous in the water. The amount of phosphorous in the water has increased on the Northeast Coast since the last survey in 2005/2006. Sediment quality has also deteriorated since 2005/2006, mostly due to sediment toxicity. Only 60% of the sediment sites sampled were rated as good quality sediments. However, the sediment toxicity doesn’t seem to be affecting much of the biological communities which have stayed about the same.


Coastal water in the Southeast is only rated good for about 21% of the sites sampled in 2010/2011. Frankly coastal water quality in the Southeast is just not very good due to the amount of phosphorous in the water. These waters are actually worse than those in the Northeast. Sediment quality has also decreased in the Southeast because of an increase in the amount of contaminants found in samples during 2010/2011 sampling. The Southeast sediment quality is rated good at about 65% of the sites sampled. Biological communities are only rated good at about 60 % of the sites sampled and really they haven’t changed much in the last 10 years.


It gets worse when you look over at the Gulf Coast. The Gulf coast hands down has the worst water quality in the U.S.  Only about 16 % of the sites sampled have good water quality. The culprit again is phosphorous. Water quality has declined significantly over the last 10 years because of increasing amounts of phosphorous. And the Gulf must be absolutely wracked with algae based on the chlorophyll a amounts, which are the highest of all coastal waters in the U.S. Not surprisingly sediment toxicity increased for the 2010/2011 assessment. A rather notable event occurred in April of 2010 when the Deep Water Horizon exploded and leaked oil into the Gulf for almost 3 months. There was a 15 % decline in good sediment quality among the samples taken in 2010 compared to the samples taken in 2005/2006. The EPA report states the biggest decreases in sediment quality in the Gulf were in the oil spill area as a result of sediment toxicity. However the EPA report can’t directly link the oil spill to the increase in sediment toxicity because of the limited contaminants the Agency samples for in these periodic coastal assessments. It’s a head scratcher, but then there are probably better studies out there related to the impacts of the Deep Water Horizon oil spill. One of the interesting findings is that biological communities on the Gulf floor actually increased from 2005/2006 to 2010/2011 – by a lot. The good rating went from 24% to 60 %. That is a significant change which is explained in the report as being a result of missing data from 2005/2006. Apparently 47% of sites were not sampled for benthic data during that timeframe.


The West Coast has the best water quality in the U.S. Some 64% of coastal waters there were in good condition. Again the big contributor to water degradation was phosphorous. There was a lot of missing sediment data; 19 % of sites were not sampled. In my book, that is probably too much missing data to really say much about the overall quality of sediments on the West Coast. There are a lot of mixed results from year to year for the West Coast. For example there was a 25% decline in water quality rated good between the 1999/2000 and the 2005/2006 event and then a 15 % increase in waters rated good quality from 2005/2006 to 2010/2011. Biological communities rated good showed a big decrease in 2010/2011 from 2005/2006, but then again there was a lot of missing data from 2010/2011; 21 % of sites were not sampled. So I find the changes a little suspect.


The other measure EPA looked at was fish. There were no coastal areas rated good for fish. Basically most of the fish were rated in poor condition: 42 % on the West Coast, 69 % in the Gulf, 57 % from the Southeast Coast, and 33 % on the Northeast Coast. The fish on every coastline of the U.S. are contaminated with selenium, mercury and arsenic to such an extent that they are simply not good for the wildlife in those areas to eat. EPA made the surprising assessment that it is selenium which is the most widespread contaminant exceeding fish tissue contaminant levels harmful to wildlife.


There are a couple of serious take aways from this report. One, all of our coastal water have a serious problem with phosphorous levels. Two, significant numbers of coastal fish have so much selenium in them that they are not healthy for the wildlife to eat.


Both phosphorous and selenium are natural elements which are widely distributed in soils and rocks. Phosphorous also comes from phosphate rock which is mined and processed for phosphate fertilizer. Phosphate fertilizer is applied to lawns and agricultural fields and without sufficient water management is carried into our streams and rivers as runoff. Interestingly selenium is also found in phosphate rock. Selenium runoff has been of great concern at the phosphate mines in Idaho. But selenium has many other sources too, including coal. EPA does not speculate on the source of the selenium found in the fish tissue.