Tag Archives: Dams Environmental Impact

Dams and other river engineering features impact on the environment

Bloede Dam Removal

It looks like the state of Maryland is finally prepared to remove the Bloede Dam on the Patapsco River. The Maryland Department of Natural Resources (DNR) has been examining the impacts of the removal for about seven years and at last this old dam built in 1907 is on its way to the scrap heap. I ask everyone to give a rousing cheer for the state of Maryland. This will be the third dam removal on the Patapsco. The goal is to return the river to its natural free flowing state and restore passage up and down the river for fish and other aquatic animals, especially the migratory ones like shad, herring and eels. Think about it, these poor fish haven’t been able to return to their historic spawning grounds in over a hundred years. And on top of it all the Bloede Dam is a public safety hazard and has been so for years because it is no longer in use and it is easily accessible because of its location in the highly over used Patapsco State Park. There have been 3 deaths at the Bloede Dam just in the last 10 years.
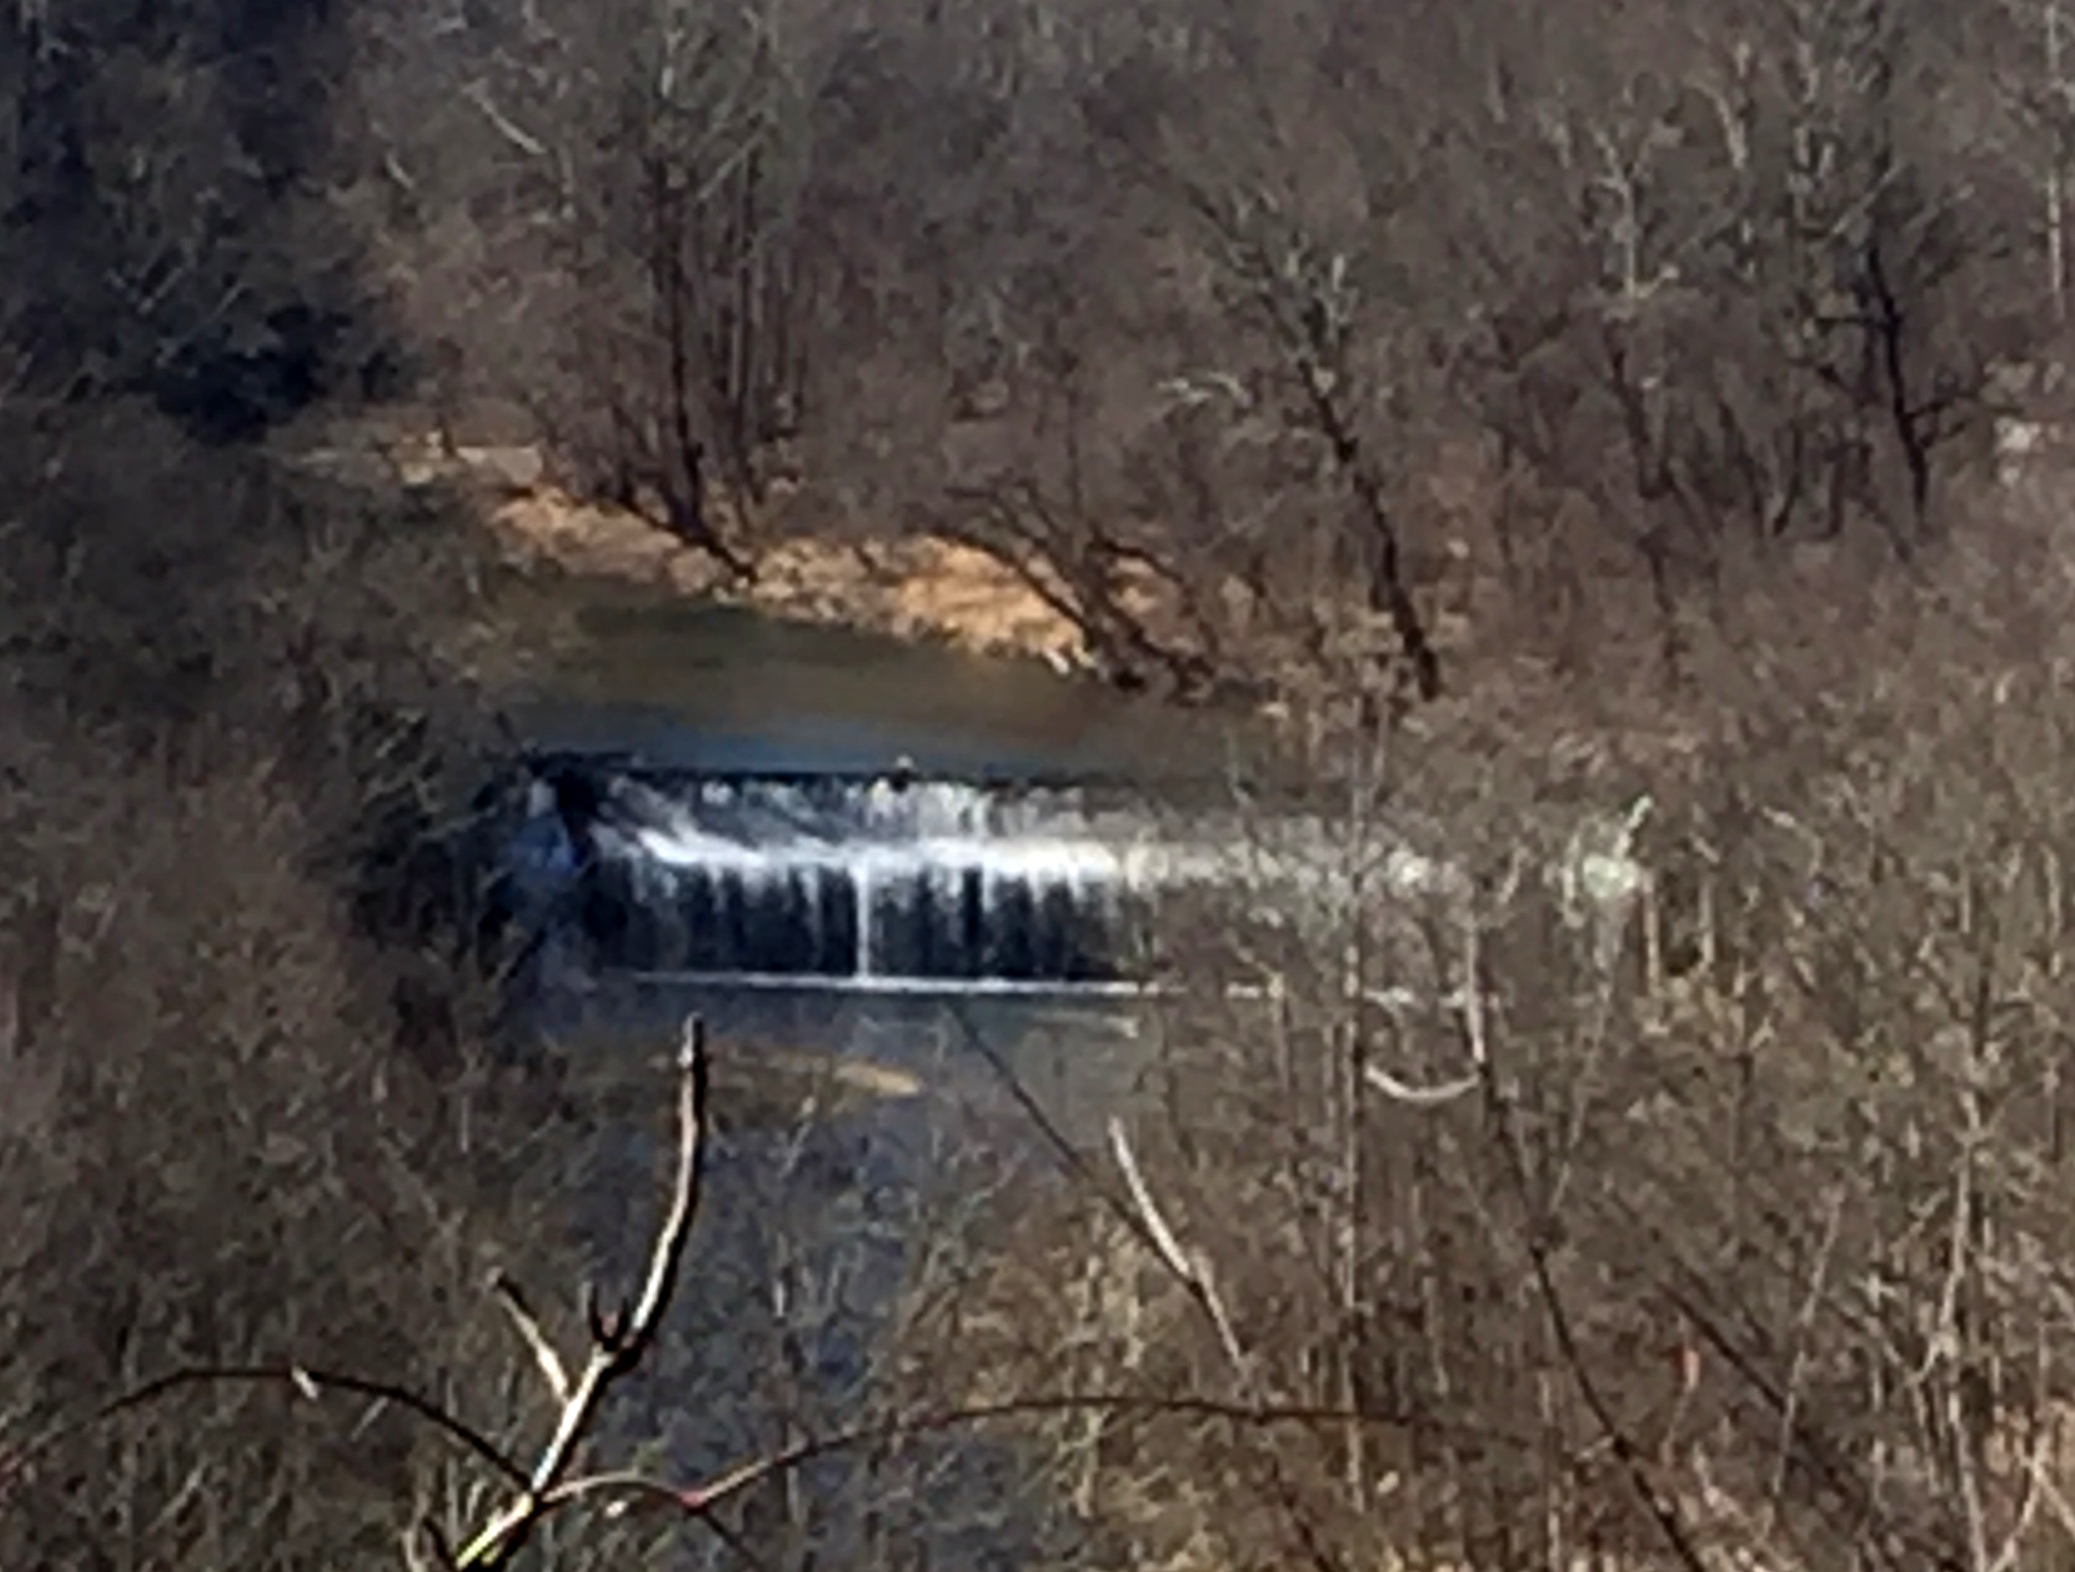
Bloede Dam 2016

For those of you who don’t know where the heck the Patapsco River is, think Baltimore. The river’s watershed spans four counties in Maryland and drains the nasty Baltimore Inner Harbor as well as agricultural and suburban areas. It flows into the Chesapeake Bay which has been undergoing crisis level water quality issues for eons. There is a whole big federal government endeavor called the Chesapeake Bay Program which was established to “clean-up” the Bay at the cost of about $70 million a year.


The decision to remove the dam allows for the natural transportation down the river of the sediment backed up in the impoundment behind the dam structure. I was a bit surprised about the decision as I would think the sediment behind a dam in such an urbanized area would be full of contaminants. So I checked out the DNR decision documents on the release of the sediments and was surprised but happy to see a classic study of both the sediments to be released and the impacts on the environment and the hydrology of the river. The results can be found in two documents: 1) Bloede Dam Biogeochemical Impacts – An Analysis Based on Patapsco River Nutrient Balances by the University of Maryland Center for Environmental Science and 2) Bloede Dam Sediment Transport in the Patapsco River, produced by American Rivers. American Rivers is my favorite non-profit environmental organization of all time. In my opinion, most environmental non-profits are just loaded with lawyers who spend their time suing the Environmental Protection Agency and other government organizations. American Rivers is full of scientists who actually are doing something to improve the environment. The DNR has partnered with American Rivers along with a number of other state and federal organizations in the study of the dam removal.


The Bloede Dam impoundment contains approximately 312,000 cubic yards of sediment of which about half is coarse sand and gravel with the other half being silt. Twenty cores were taken of the sediments with 14 analyzed for contaminants. Miraculously no contaminants were found, not even mercury or polychlorinated biphenyl (PCB) which both bedevil other river systems. However there is phosphorus associated with the silt in the impoundment. Phosphorous and nitrogen are two of the main players in the continuing saga of poor water quality in the Chesapeake Bay. Extraordinary efforts are being made to reduce these two nutrients entry into the Bay because they contribute to algal blooms which deplete oxygen in the water. Oxygen depletion has resulted in the development of several dead spots in the Bay which are essentially no go zones for fish since fish are like us and need to breathe.


So the DNR was alarmed. After all you don’t want a big gulp of silt containing phosphorous rolling down the river into the Bay. A biogeochemical study was conducted to determine if the phosphorous in the river would result in any environmental impacts. A lot of work has been done on phosphorous in the last 20 years and much of it has been associated with studies of the Chesapeake Bay. Just because there is phosphorous in the sediment doesn’t mean that it is going to be released into the water. A lot of variables play into whether the phosphorous leaves its comfy home in the muck to become a dissolved phosphorous micronutrient available to feed the algae. Muck is not really a technical term but it is probably the best description of the organic and inorganic mixture of particles found in estuaries like the Chesapeake Bay. The researchers at the University of Maryland say the chief factors in the Bay area in the adsorption and desorption of phosphorous onto fluvial particulates are the presence of iron oxides and the conversion of iron oxides in low oxygen environments to the meaner, tougher, uglier iron sulfide species.


What does this mean? It means that there is a continuous stream of dissolved phosphorous entering Bay waters from sediments deposited in its low oxygen dead zones. As long as you have iron oxides precipitating in oxygenated waters than you will have phosphorous also precipitating from its dissolved form with both ending up in the sediment. Where you have iron oxides clinging to the muck already, then your phosphorous will cling to the muck too. Where there is low oxygen and the formation of iron sulfides then dissolved phosphorous will be released into the water. So according to the guys at the University the Maryland Center for Environmental Science the presence of oxygen controls the release of phosphorous.


Any phosphorus in suspended sediments flushing out of the Patapsco River into the Bay would then really occur after the sediments are deposited. The researcher used a model developed by the Chesapeake Bay Program to determine how many grams of phosphorous per meter per day were likely to enter the Chesapeake Bay after the destruction of the Bloede Dam. They then expanded the model to determine the yearly input of total phosphorus and dissolved phosphorus which would enter the Bay. They estimate 85,000 pounds of phosphorus are tied up in the silt behind the Bloede Dam. They assumed about 50 percent of the phosphorous was tightly bound up in the silt. The researchers also were able to use other studies to determine that most of the sediment would be spread out over the extent of the Patapsco River and would not be entering the Bay. Once any sediment makes its way to the Bay, the phosphorous will only be released to the water and available to algae under very low oxygen conditions. The researchers therefore concluded that there was very little concern from allowing a natural release of the sediments.


It’s a good thing because dredging the sediment and trucking it away for disposal was estimated to cost an additional $20 million and add a year to the dam removal schedule with trucks operating 24 hours a day to haul off the impoundment’s sediment.


The release of the sediment will definitely have short term impacts on the river downstream from the dam. The dam is about 11.5 miles upstream of the Patapsco River’s entrance to the Bay. Sediment release will result in muddy water as the sediments are picked up and moved downstream in the flow. How muddy depends on the amount of precipitation received following the dam’s removal. If there are heavy rain events then the sediment will move quickly downstream and it will take only 4 weeks to empty the impoundment. Little rain and it will take 6 months. There will be temporary effects of course. Sediment deposits are expected to be 4-6 feet immediately downstream of the dam. It will bury fish habitat, fill pools, and create sand bars but eventually the river will begin to recover its pre-dam profile. Hydrologic models predict within 6 years. A worthy achievement for some short term pain.
An American River in Distress

Trivia question for you. What is the largest American river that does not empty into a sea? I’ll give you a hint. If you look down from the edge of the Grand Canyon, you’ll see this river twisting and winding its way through the scenic gorge it carved out of the mile thick rock layers on which you are standing. Yes, the answer is the Colorado River. Don’t believe me? Check out the photos in this U.S. Geological Survey fact sheet on the 2014 Bureau of Reclamation’s one-time historic release of water from reservoirs on the Colorado River (https://www.usgs.gov/news/a-river-ran-through-it-and-brought-life-least-a-while ), during which water finally reached the Sea of Cortez in Mexico. Water from the Colorado River has only reached the sea a couple of times since the 1960s. Why? Because, the Colorado River is not really a river anymore. It is just a 1450 mile long over engineered water supply ditch.


There are eight major reservoirs on the Colorado River. (Reservoirs are dammed structures that hold water). The Colorado has several famous reservoirs – Lake Mead behind Hoover Dam in Nevada and Lake Powell behind Glen Canyon Dam in Utah. In 2015, the eight reservoirs on the Colorado River were storing 30.2 million acre feet of water. Hydrologists and engineers use “million acre feet” as a way to measure water. An acre foot is around 326,000 gallons or essentially enough water to cover an acre of land with one foot of water. Currently, the reservoirs are at only 51 % of their capacity. Storage capacity for the reservoirs is about 60 million acre feet or somewhere around four years worth of the annual flow of the river. Yes that’s right the average yearly flow of the river over the last 100 years is about 16.4 million acre feet, so more water is being stored in reservoirs than flows down the river in a given year.


The water is released as needed during years when it is very dry and natural flow falls under the average. Forty million people depend on the water from the Colorado River for their water supply and farmers depend on the river’s water for irrigation. And that’s just the United States. There’s a treaty with Mexico that requires the U.S. to provide water to Mexico. So most years between all the users, the natural evaporation, loss of water to vegetation along the river, etc. the entire flow of the river is pretty much used up. Amazing as this may seem, the problem is only getting worse.


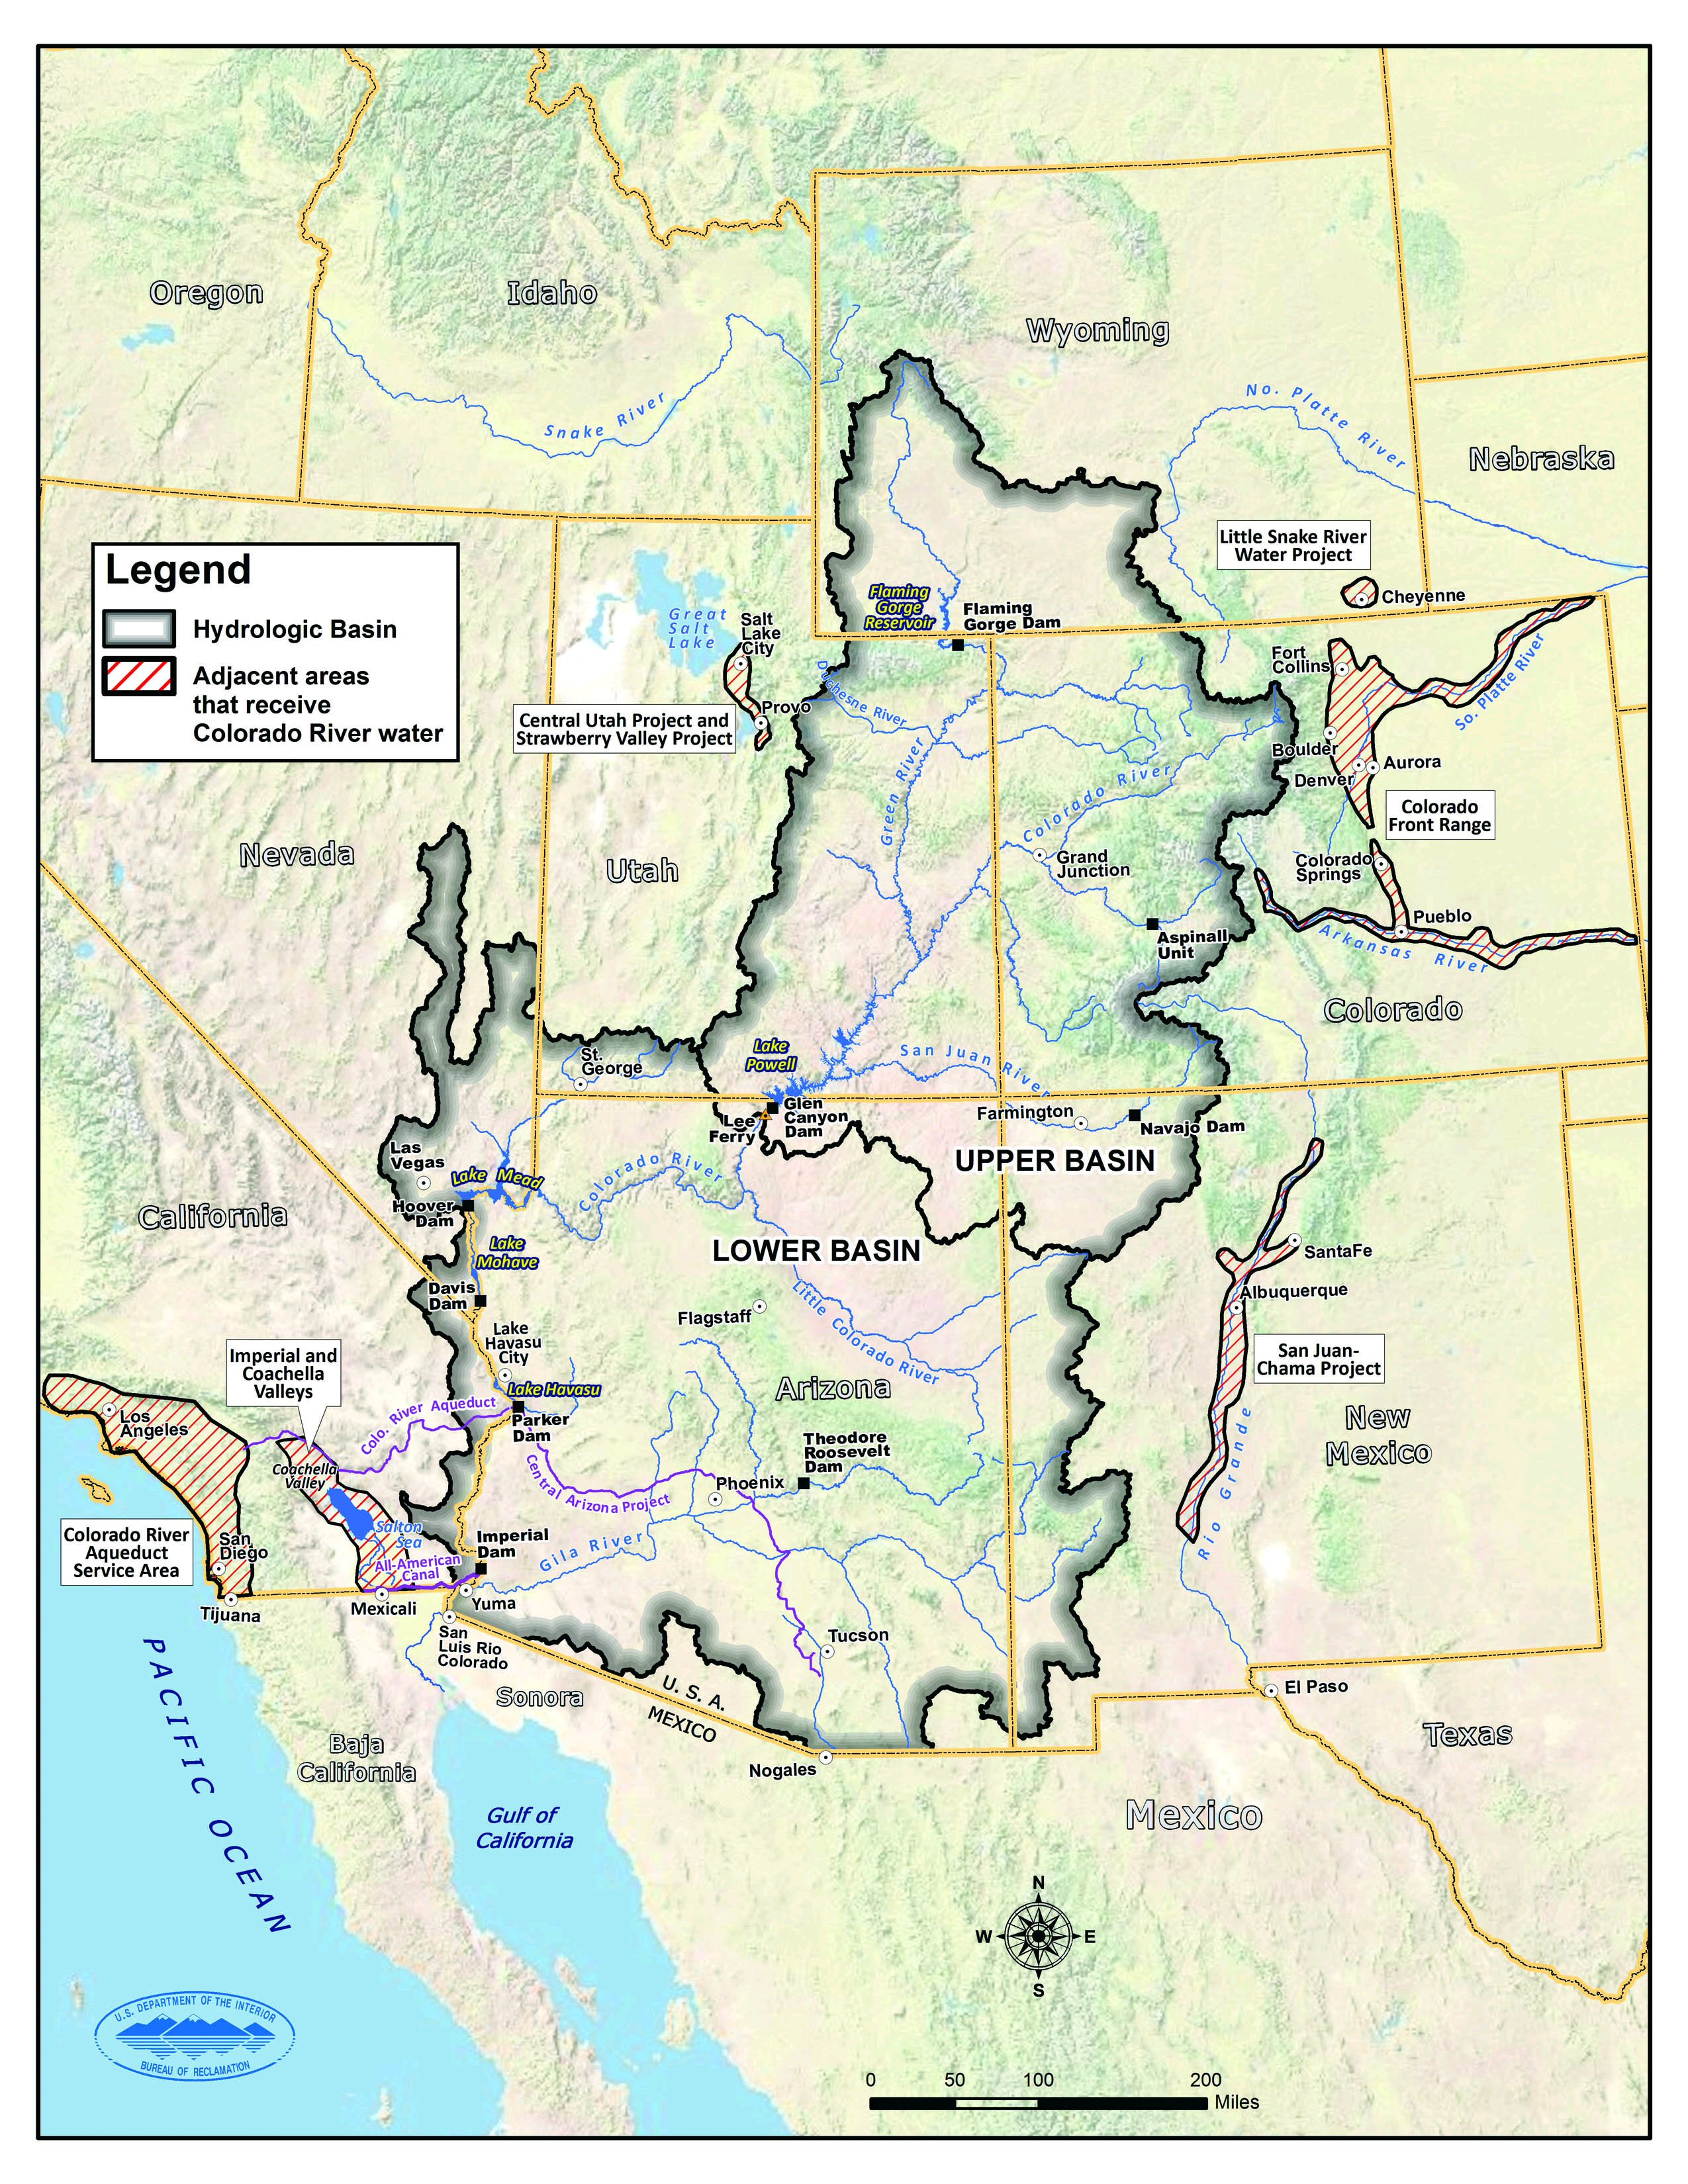
The Colorado River Basin is really big. When hydrologist’s talk about a basin they are talking about an area covered by all the tributaries of a river. This is a map of the Colorado River Basin.

Source: Managing Water in the West Colorado River Basin Water Supply and Demand Study, Bureau of Reclamation, December 2012

As you can see the basin encompasses seven states (Arizona, California, Colorado, New Mexico, Nevada, Utah and Wyoming) which are the driest in the country. Yet four of these states (Arizona, Colorado, Nevada and Utah) are among the top 10 states with the fastest growing population. This is a problem for water managers – a giant problem. They have to maintain water supply for domestic and industrial purposes, for agricultural irrigation and livestock watering, and for in-stream water flows to support wildlife and fish.


A federal agency – the Bureau of Reclamation – and the 7 Colorado Basin states manage the river’s water supply together. There has been a lot of head scratching by this group about the future water supply from the Colorado River. In fact, in 2012, the Bureau of Reclamation issued a report entitled: “Managing Water in the West: Colorado River Basin Water Supply and Demand Study.” The study looked at the future potential water flow in the river and the demands for that water all the way to the year 2060. I don’t usually cover engineering studies like the Bureau of Reclamation report in this blog, but the study is of interest because it seeks to inform decision-makers of the extent of future water supply deficiencies and options available to alleviate the deficiencies.


All sorts of decisions have been made in the past without studies. Case in point, in 1922 Herbert Hoover as Secretary of Commerce began the first in a series of decisions that would eventually make the Colorado River nothing more than a glorified pipeline for water supply eventually depriving the Sea of Cortez of a major source of fresh water flow. Hoover’s decision legally divided the Colorado River into Upper and Lower Basins using the point of Lee’s Ferry in Arizona as the demarcation line. All areas draining into the Colorado River above Lee’s Ferry are considered the Upper Basin, which includes Colorado and Wyoming and parts of Arizona, New Mexico, and Utah. The Lower Basin includes the areas draining into the Colorado River below Lee’s Ferry, encompassing the other parts of Arizona, New Mexico, Utah, and the entirety of Nevada and California. Hoover’s decision essentially gave 7.5 million acre feet of Colorado River water to each of the basins to be allocated by the states. Allocated means given a right to use the water. Ten other decisions from the 1920’s to the 1970’s form what is euphemistically called the “Law of the River” making the Colorado River one of the most regulated and controlled water bodies on the face of the earth with the sole purpose of providing water supply.


The 2012 Bureau of Reclamation study predicted possible future water supply from the Colorado River by looking at trends in the variability of the flow in the river. It looked at the historical record over the last hundred years, which is based on actual real life measurements of water flow and it looked at paleontological types of records, like tree rings, to estimate flow before measurements were kept. I think everyone knows that when you cut a tree, you see a cross section of rings. These rings can be wide or narrow depending on how much a tree grew in a particular season. If they are narrow, it indicates a dry season and the tree didn’t have much growth. A wide ring indicates a rainy period where the tree grew a lot. There are about a dozen other ways, besides tree rings, scientists use to reconstruct climate conditions. For example, scientists use ice cores from glaciers to determine rain and snowfall amounts and they use soil cores to determine the distribution of pollen and dust. This is all common sense stuff the average reader knows, when there’s more precipitation then glaciers grow, when there’s more rain then trees put out more flowers and pollen, when its dry then more dust and dirt blows around. So scientists can reconstruct the climate based on these paleontological types of data and show what the trends in stream flows were in the past. Such reconstructions are called paleo-reconstructed models of climate. The Bureau of Reclamation study developed a projected stream flow record for the Colorado River from a paleo-reconstructed model. For a third type of future water flow projection for the Colorado River, the study combined the trends based on paleo-reconstructed data with the trends based on measurements from the last hundred years. They described this projection as a paleo-conditioned scenario.


Very interestingly, the paleo-reconstructions of stream flow showed a great variability over the last 1250 years. In fact during the period between 762 and 2005 there were some hugely long dry periods of up to 16 years where stream flows were reduced beyond anything seen in recent times. Over the last 100 years there has been a general decline in stream flow. There has also been a major seasonal “shift” of when the most runoff enters the Colorado River. This shift is due to a decrease in the amount of spring snowmelt.


Projections of future water supply in 2060 from the river based on the various paleo-reconstructed models showed mean water flows of 14.7 to 15.0 million acre feet, similar to the current observed mean of 15.0 million acre feet. The study also made some projections based on the general circulation models for climate. These models are developed by the International Program on Climate Change sponsored by the United Nations. These projections were not good. Projected mean flows were around 13.7 million acre feet if temperature increases of between 1.3 and 2.4 degrees Centigrade occur – a decrease of 8.7 % from the current observed mean.


The real problem is not necessarily the amount of water available though, it is the projected future demand for water in the area. The study looked at possible future uses in the Colorado River Basin – population growth, agricultural growth, tribal water right settlements, increased energy production – and also looked at possible  increases in future efficiency in water use. You know what efficient water use is – landscaping without grass and other water hungry plants, recycled water like you see at car washes now, low flow toilets, etc. Based on a number of variations in these different factors (for example normal population growth versus rapid population growth) the projected additional water in million acre feet needed from the amount used in the Basin area today ranged from 1 % to 3 %. But we’re talking total water use here, not just the water supply from the Colorado River. Some of those increases are going to come from other sources, mostly in Colorado and California.


Expected increased needs from the Colorado River are due mostly to increased population and industrial growth. The study anticipates municipal and industrial demands from the river will grow from the 3.4 – 3.5 million acre feet today to 4.5 – 6.2 million acre feet by 2060. The study projects another 3.2 million acre feet of water above the river’s projected mean annual flow will be needed by 2060. This is what water supply managers call an imbalance. There have been occasional imbalances of this magnitude in the past, but as you’ve learned, the reservoirs made up the deficiency. A prolonged imbalance will mean less water available to store in those reservoirs. The future doesn’t look bright for maintaining water supply in the Colorado River Basin without some big changes either in development of new water sources, like desalination of ocean water and importing water from other rivers in the U.S. through pipelines and via ocean going tankers, or massive water conservation and watershed management projects. In the end, the Colorado River becomes even less of a river and more of just a conduit for water supply. How far upstream will the trickle come to a stop?


Environmental Impacts of Removing Dams

For years I followed the Klamath Dam removal proposal. The Klamath River flows from Oregon through California, cuts through the Cascade Mountains, and empties into the Pacific. The dams on the Klamath are a classic case of a bunch of old dams (built as a result of Congress’s authorization of the Reclamation Act of 1902) making an unnatural mess both environmentally and economically. It is probably where the term “farmers versus fish” comes from. Building hydroelectric dams with reservoirs on the Klamath River provided irrigation water and cheap electricity for farmers. However it decimated the fish population. Enforcement of the Endangered Species Act (authorized by Congress in 1973) required dam operators to release a minimum flow of water from the dam reservoir to protect three different endangered fish downstream, including the Coho Salmon. There was a big uproar during the first decade of the 21st century when drought in the Klamath River Basin resulted in a cutoff of water for irrigation to farmers in order to protect the endangered fish (fish 1, farmers 0). Then there was an Administration change in the White House and the minimum water flows from the dam reservoir sustaining the endangered fish were reduced and more water was released for irrigation purposes (fish 0, farmers 1). Reduction of minimum flows led to a huge fish kill of Coho Salmon and restrictions on salmon fishing in the Pacific Ocean. In all cases people were ticked. Farmers were ticked, fishermen were ticked, native tribes who depend on fish for subsistence living were ticked, environmentalist were ticked.


Then the electric company who operated the dams decided that providing hydroelectric power from the Klamath dams wasn’t very economic. From what I recall, the electric company wanted to raise electric rates by about a 1000 percent. As you can imagine, that didn’t go well for the company at all. Then re-licensing of the dams came up, and the company decided the dams weren’t worth operating anymore. So, this all led to a proposal to remove the dams. There was a whole lot of uproar about that too. But interested parties, meaning the states of California and Oregon, native tribes and the electric company came to an Agreement in 2010 to seek removal of the dams. Unfortunately, nobody wanted to pay for the dam removal. I think there was some federal legislation proposed around 2014, but the estimated costs were pretty astronomical and the legislation has gone nowhere. If it ever gets passed, it will be the largest dam removal project in the United States. And it will give us the results of what the environmental impacts of a dam removal to a major river system will be.


Right now we don’t have the answers to what the actual environmental impacts of dam removal are. There are studies of course, which outline what scientists believe will happen. But the actual studies of what really happens after dam removal are pretty limited. There are a number of dams around the country which have been removed, but up until the last ten years no one has been studying the effects of dam removal on changes in sediment transport and stream morphology or changes in plant and fish communities. For instance, there’s a dam removal program in Massachusetts. I’ve heard a number of talks at restoration conferences about efforts to restore streams in Massachusetts. Massachusetts has been highly populated by non-native people for quite awhile. They are the Plymouth Rock folks who came over on the Mayflower. Once these non-native people arrived, they started damming streams and rivers up – mostly for mills; first flour mills then textile mills. They have some 3000 dams in the state, many built between the 17th and 19th century. Can you imagine? Many of these dams are not even functioning for any purpose, but they are still there mucking up fish habitat and natural stream functions.


Massachusetts has an aggressive dam removal program, but if you go to look for reports on the impacts after the dam is removed, you will not find any. You’ll find feasibility studies for the removal of a dam, you’ll find studies of the contaminated sediments existing in many of the dams in the industrial areas in eastern Massachusetts, and you’ll even find records of community input to dam removal. But I’ve yet to find a report documenting changes to a stream or river after a dam was removed in Massachusetts. There’s probably a reason why. It cost money to study a stream or river system after the dam is removed. Also everybody thinks dam removal will restore natural stream functions, so why bother to study the actual results. The lack of information on the impacts of dam removal has been so great, that the Gulf of Maine Council on the Marine Environment put together a document in 2007 outlining procedures for monitoring the outcome of dam removal. It is entitled “Stream Barrier Removal Monitoring Guide” (http://www.gulfofmaine.org/streambarrierremoval/). Massachusetts is one of the American states whose river systems empty into the Gulf of Maine. The Council cited lack of post dam removal monitoring data nationwide as a reason for establishing monitoring procedures. It has been the “hue and cry” of restoration specialists everywhere that there is money for restoration but no money for monitoring the results of restoration to see whether the efforts have succeeded and to what extent.


The Council’s guide is a pretty good one, especially when examining the hydrological impacts of dam removal. The guide’s monitoring parameters include such items as establishing monumented crossections downstream of the dam, conducting longitudinal profiles of the stream, and determining sediment grain size distribution. Cross sectional profiles will document how the stream banks and channel width adjusts to post dam removal flows and the increases in sediment being transported by those flows. The longitudinal profiles along the length of the stream will show how the channel slope is adjusting to the dam removal and what natural stream characteristics like pools and multiple channels are being created. And sediment grain size distribution studies will help determine whether you are getting more fine sediment in the channel and whether the newly free flowing stream has the power to move coarser sediment further downstream. These are all terrific ways to tell if your stream or river system is righting itself to pre-dam conditions.


The only full studies I have ever seen of post dam restoration are from the Elwha Dam removal in Washington State. Actually there were two dams on the Elwha River – the Elwha Dam and the Glines Canyon dam. The dams were built back during the dam building heydays of the early 1900’s. The Elwha River flows north out of the Olympic Mountains into the Strait of Juan de Fuca. It’s outlet into the straits is just a little west of the town of Port Angeles, which I like to think of as the gateway town to Olympic National Park, but other people know it better for its ferry service to Victoria, British Columbia. The two dams sat right in the Olympic National Park and the Park Service has lots of great photos of the dams and the dams being removed (http://www.nps.gov/olym/learn/nature/elwha-ecosystem-restoration.htm.) The dam removal began back in late 2011 so they are gone now. Several years worth of post dam removal data has been collected. I pulled out some recent papers on the results. They are actually quite phenomenal. Probably the best one was published in 2015 in the journal Geomorphology. Geomorphology for all of you non-scientists is the study of landforms and how they developed. It was one of the first geology classes I ever took and it is a fascinating subject. You get to examine all sorts of topographical and geologic maps, aerial photos and satellite images. So the paper (referenced below) was on coastal geomorphic changes as a result of the dam removal.


First of all, the Elwha is a short river. It is less than fifty miles long. Coming off the north face of the Olympic Range, its vertical profile (as you can imagine) is quite steep. Studying such a steep river by conducting the kind of longitudinal, cross sectional, and grain size studies downstream of the dam, which are recommended in the “Stream Barrier Removal Monitoring Guide” referenced above, would be seriously hard and probably of little use. But studying the output of the river to its delta in the Strait of Juan de Fuca will tell you a lot. Beaches and land on the strait near Port Angeles have been eroding for some time. The dams have been storing up all the sediment coming off the north slope of the Olympic Mountains in the Elwha River Basin and robbing the shoreline. The study states there was 20 million cubic meters of mud, sand and gravel stored in the reservoirs behind the two dams. The study further estimated, based on the accumulation of sediment in the reservoirs, 240,000 cubic meters of sediment a year was prevented from being carried down the Elwha River to the delta and shoreline. This is a lot of sediment. The delta and beaches were essentially being starved and the constant erosion by tidal currents and waves was taking its toll on the shoreline.


During the first year of dam removal the researchers measured 113,900 cubic meters of new sediment deposition on the delta, beaches and seafloor. This is five times what was being deposited before dam removal. In addition, the researchers measured changes to the delta found at the mouth of the river. They found the delta had increased in size by 100 meters. During the second year, researcher measured 2,221,000 cubic meters of new sediment deposited on the delta, beaches and sea floor. This increased sediment accumulation and extended the delta at the river outlet another 200 meters offshore. Shorelines east of the river mouth were measured to have extended an average of 40 meters into the strait. With all this new sediment, researchers saw some big changes on the sea floor. Before dam removal the seafloor was rocky, because no fine sediments from the river were entering the strait. The rocky seafloor supported a lot of different kelp species. With the increase in sediment, the kelp population is decreasing. The researchers reported the area was moving toward a river dominated geomorphology, just as it was nearly a hundred years before the dam was built. So, it looks like in the case of the Elwha River, natural processes are being restored once a dam has been removed.


Here’s the full reference for the Elwha Dam Removal:  “Large Scale dam removal on the Elwha River, Washington, USA: Coastal Geomorphic Change”, Guy Gelfenbaum, Andrew Stevens, Ian Miller, Jonathan Warrick, Andrea Ogston, Emily Eidam, Geomorphology, Vol 246 (2015), pp. 649-668.

Dams and their Impacts on Rivers and Streams

There’s a large body of scientific work going back several decades on the impacts of dams to rivers and streams. Scientists have looked at dams all over the United States to determine what the impacts are both downstream and upstream of the dam. Upstream effects seem pretty similar, but downstream impacts are variable depending on what the dam is operated for and how the dam is managed. For example if the dam is used for hydroelectric generation there is a regular release of water depending on when electric power is needed to feed the overall electric grid. Oftentimes that electric generation is needed during peak daytime hours and not needed so much at night. Sometimes the power is needed more in the summer to supply electricity for all the air conditioners running out there and needed less in the winter. If the dam is being operated for water supply, flood control or recreation, then there may be state to state contracts or other management controls on how much water has to be released on a daily basis to provide water for downstream users. The water releases in these circumstances can be more controlled by the dam managers. They can release it continuously or they can release it intermittently. It depends on what the management controls are. Do they need to provide water for downstream fish habitat? Do they need to supply a certain number of acre/feet of water downstream for irrigation? Do they need to provide freeboard in the reservoir to avoid destructive flooding? Controlled releases are kind of a new game in dam management. In the heyday of dam building in the early 20th century, there certainly was no thought of controlled releases or providing sufficient water downstream. It took the Endangered Species Act and a bunch of ticked off water users with an army of lawyers to put management controls in place.


It has been a long time since a new major dam was built in the United States. I suspect any new dam wouldn’t make it through a review under the National Environmental Policy Act (NEPA). But when most dams were built, there was no NEPA. There are a lot of dams. A statistic from the U.S. Geological Survey claims there are 75,000 dams over six feet high in the United States.  The high dams like Glen Canyon Dam and Hoover Dam on the Colorado River have big reservoirs behind them. When the dams were first built, it took a while for those reservoirs of water to fill up and form the giant artificial lakes which exist today. What happens to those reservoirs is kind of interesting and is a big impact to both the upstream reservoir and the downstream river. The reservoir starts filling up with sediment. Essentially a river gets to the reservoir and drops its load of sand, silt and clay. After so many years, the reservoir fills up. There are a couple of problems with this. Oh for heaven’s sake, there are tons of problems with this.


Number one, the sediment accumulating in the reservoirs is not always very nice. Some of it is contaminated from past industrial practices which released water with contaminants upstream of the dam. Sometimes the sediment entering the reservoir is full of naturally eroded minerals from upstream areas with lots of metals and this results in an accumulation of toxic metals in the reservoir. And reservoirs can be full of agricultural runoff with loads of phosphate and nitrogen. The reservoir accumulates all these contaminants and it results in a great big mess of nasty sediment at the bottom. If you wanted to remove a dam as many environmental advocates propose, you might have to deal with the release of reservoir sediment as a potential source of toxins to fish and other wildlife downstream. Good grief.


Water released out of a dam and flowing downstream is free of sediment. It’s nice clear water. It comes right out of the gates or spillways on a dam like spring water; sometimes just as cold. The big problem with water rushing out of a dam clear and free of sediment and with big gaps between flows is that it is unnatural and what happens as a result is unnatural. A lot depends of course on how the dam is managed but typically the released water starts undercutting rivers banks immediately downstream and scouring the riverbed.


In some southern rivers the river downstream of a dam begins to look like a big muddy mess with highly eroded concave banks where trees actually are perched out on a shelf over the river. Once the river reaches the coastal areas and sea level, the velocity of the water flow slows down and it spreads out into the wetlands where all that new sediment drops out, essentially choking up the marshland.


If it’s a western river, water released from a dam starts scouring the downstream river bed and removing sediment in the form of sandbars. Some people describe it as armoring the river bed. Essentially the released water removes all the sand and silt downstream, leaving nothing but gravel, cobbles and bedrock. The only thing that can move the gravel and cobbles is a good flood and guess what? A dam controlled river rarely floods.


In the north and Midwest, rivers are so frequently dammed in series with numerous reservoirs joined by short stretches of river channel that practically no sediment makes it down the river. As a result, downstream beaches on shorelines become starved of new sand. Or in the overpopulated and overdeveloped east coast, the dam retention of sediment offsets the huge amount of eroded material coming in downstream from cities and agricultural lands. On some rivers in the east if the dams weren’t there, all the extra sediment now in reservoirs would be clogging up estuaries and creating excessive need for dredging in ports and navigable waterways.


Probably one of the more interesting questions about the sediment in the reservoirs behind dams is: What happens when the reservoir fills up with sediment? A lot of dams on rivers in the United States were built in the early 1900s. They have been accumulating sediment for a long time. You’d think some of them would be almost full by now, wouldn’t you? Well it just happens some of them are. Take for example the dams on the Susquehanna River. The Susquehanna River is a huge river. It is one of the largest rivers in the United States and flows about 450 miles through New York, Pennsylvania, and into Maryland’s Chesapeake Bay. There are three dams on the lower Susquehanna River. The last dam on the Susquehanna River is the Conowingo Dam about 10 miles upstream from the River’s entry into the Chesapeake Bay. It was commissioned in 1928. This dam is almost 90 years old. It has been collecting sediment for a long time.


Back in 2011, a very big storm passed over this part of the country. It was called Tropical Storm Lee. If you passed over the Chesapeake Bay Bridge anytime in the immediate weeks following that storm, you would have seen a big muddy mess with trees and garbage floating down the bay. A lot of the muddy mess was caused by sediments out of the Conowingo Dam. The Geological Survey did a great study after the storm. They have had a stream gauge at the Conowingo Dam for almost 50 years. The gauge measures water volume flowing through the Susquehanna at the dam. In the last 30 years measurements for nitrogen, phosphorous and suspended sediment also have been taken. The Geological Survey said the discharge at their stream gauge after Tropical Storm Lee was the second largest maximum daily flow in the history of monitoring at the station. Flow is measured in cubic feet per second. So the stream flow on September 9, 2011 was 709,000 cubic feet per second. The only flow higher was during Hurricane Agnes in 1972. Hurricane Agnes is kind of legendary in the Mid-Atlantic States. If you visit Maryland, Virginia and Pennsylvania you will see commemorative signs everywhere about the impacts of the floods during Hurricane Agnes. The National Oceanic and Atmospheric Administration reports 122 people were killed during the Hurricane.


The Geological Surveys report says the reservoirs behind the three dams on the lower Susquehanna are almost full of sediment; they give a calculation of 80 percent. They further say that flood events are creating sediment scour within the reservoir and the sediment now flows downstream when floodwaters are released. This is what happened after Tropical Storm Lee. They also have calculated what flow levels will scour the sediment and send it down the river and into the Chesapeake Bay – 390,000 cubic feet per second. The Geological Survey calls this the “scour threshold”. But they also note as the reservoir continues to fill, the normal surface slope in the reservoir will increase resulting in increased velocity of the water on a day to day basis. Eventually the “scour threshold” will be at a much lower discharge rate than 390,000 cubic feet per second. So people who live along the Chesapeake Bay will be in for more muddy messes flowing through their lovely estuary. Also coming with all those suspended solids will be all the other contaminants that the dam has been holding back. Of greatest concern will be the phosphorous and nitrogen. The Geological Survey pointed to an earlier report from the mid-1990’s which calculated reservoirs were trapping 2 percent of the nitrogen and 40 percent of the phosphorous the Susquehanna River would have otherwise been contributing to the Chesapeake Bay. Bad news for the denizens of the Bay, like Rockfish and blue crab as algal blooms will increase, consume oxygen and result in zones where fish and crustacean cannot survive.  Here’s a link to the Geological Survey’s great report:  http://pubs.usgs.gov/sir/2012/5185/pdf/sir2012-5185-508.pdf


Dams and their Impacts on Wetlands

In my post on the Clean Water Rule and floodplain wetlands, I mentioned floodplain wetlands had been reduced so much after hurricane Katrina that scientists were concerned about the increased risk of flooding from future storms. I didn’t have time while I was writing the post to do a fact check on how much of the wetlands in Louisiana had been impacted, but I decided to follow-up just for my own information. I sat through a presentation by U.S. Geological Survey scientists twice on this subject, so I went looking to see if I could find the information on their website. I was amazed to find the very PowerPoint presentation I’d seen some eight years ago now.  It was produced by the Geological Survey’s Wetlands Research Center and the Louisiana Coastal Area Land Change Study Group. It provides a close look at land loss after the hurricane in comparison to land loss before the hurricane. They used satellite images to make their determination. I also found their final report on the subject: “Land Area Changes in Coastal Louisiana after Hurricanes Katrina and Rita.” (Here’s a link:http://pubs.usgs.gov/circ/1306/pdf/c1306_ch5_b.pdf). Bet you forgot about Rita, but yes there were two very destructive hurricanes affecting the Gulf Coast in 2005. The final report put the loss of wetlands from the two storms at a total of 217 square miles.


That sounds like a lot doesn’t it? But the reports from the Geological Survey put wetland loss from 1956 to 1978 in Louisiana at about 40 square miles a year. That’s an 880 square mile loss over 22 years. The Geological Survey also reports an approximately 35 square mile loss of wetlands per year from 1978 to 1990 for a 12 year loss of 420 square miles. Of course all these losses took years not hours to occur, but what is the reason for such incredible losses of wetlands?


People who are familiar with Louisiana and the great Mississippi River know the answer to that question. The Mississippi River isn’t really a river any more. It’s just a channel conducting water. The same goes for its major tributaries: the Missouri River, the Arkansas River, the Ohio River, and so on. Yes the mighty Mississippi, storied in American history and literature, is an over engineered navigational conduit to get goods from North to South and a pesky source of flooding to landowners along its length. The start of all the troubles began early, even before Mark Twain’s time as a steamboat captain. The steamboats went aground all the time in big piles of snagged trees in the middle of the river and on sandbars. So engineers devised ways to remove those snags and dredge the sand. But the real change for the Mississippi came after the flood of 1927, which was the beginning of the end for the free flowing great water body. I went back to the Army Corps of Engineers documents and also looked around at some of the National Research Council’s reports, but the best document I found on the channelization of the Mississippi came from a compilation report produced by the Geological Survey back in 2012. It is titled: “A Brief History and Summary of the Effects of River Engineering and Dams on the Mississippi River System and Delta.” (Here’s a link to the report: http://http://pubs.usgs.gov/circ/1375/C1375.pdf).  I like the Geological Survey’s reports. They are always well written, not like the mumbo jumbo you get out of some federal science agencies.


The report says that in 1927 about 43,500 square miles of land in 7 states was flooded and 246 people were killed. The flood of 1927 was kind of a legendary flood but most people today have never heard of it. All sorts of historic events are claimed to be a result of the flood, including the great migration of displaced African Americans from the Mississippi delta to northern cities and the election of Herbert Hoover as president of the United States based on his oversight of the flood relief efforts. (Presidents Hoover and Carter are the only engineers ever elected president). Basically a plan was implemented starting in 1929 to straighten out this flooding problem. And I do mean straighten out. Rivers are big complex bodies of water. They don’t have one channel, they have multiple channels. They meander over their floodplain. The basic mechanism creating meanders is high velocity water undercutting a river bank then depositing the sediment downstream on a bank on the other side of the river where the velocity of the water is lower. A program of cutoffs was instituted to reduce the number of channels and to cutoff large meanders. This program literally shortened the river. The lower Mississippi river lost some 145 miles as a result of this program. Then revetments were added to the banks of the Mississippi. Don’t know what a revetment is? They are essentially concrete mats that cover the entire bank of a river all the way to where it joins the submerged river bed.  Rip rap is also used. Back when the engineers were first seeking to control the river, they used a lot of rock and matting. The idea is to stop bank erosion and keep the river from migrating.


There were already levees before the time of the 1927 flood. Now there are miles of levees. You probably remember seeing them on television during the Katrina hurricane coverage. They are tall, wide compacted, earthen dam like structures that parallel a river. The Geological Survey says there are 3500 miles of levees just in the lower part of the Mississippi River Basin. There are levees everywhere in Louisiana on the banks of the Mississippi. In New Orleans you can stand on the ground in some areas and see the levees towering overhead with the river at the crest of the levee and a cargo boat steaming by above you. The levees are there to keep the river from flowing into its’ floodplain when water in the river is high. They also starve the floodplain of sediment and nutrients.


The other types of engineering control you’ll find on the Mississippi River are floodways and dikes. You’ll see floodways in New Orleans and other towns on the Mississippi River. They are there to redirect flood waters from the river away from a city into an area that is not quite as populated. They are big structures and the lower Mississippi in Louisiana has three really large ones. Dikes are just like the dikes you see sticking out into the ocean when you go to the beach, but on rivers they are usually protruding at an angle from the river bank. The purpose of the dikes is to direct the strong currents away from the bank to prevent erosion and meandering. What results is a strong current right down the middle of the river which scours out the river bed sediments and actually makes the river deeper.


One thing you won’t see on the Mississippi River thank goodness is a dam, at least in the lower part of the river. The upper Mississippi has a series of navigational locks and dams starting around Minneapolis that extend down to the Missouri River. All the main tributaries to the Mississippi have dams though. The Missouri river has six big ones. The Missouri River is essentially a system of reservoirs interspersed with channels. Again the dams provide flood control, but the big thing they prevent is sediment moving down into the Mississippi River. The Geological Survey says that the dams on the Missouri River have resulted in an enormous amount of sediment from reaching the Mississippi River and subsequently the floodplain wetlands in Louisiana. I didn’t realize that the Missouri River was the greatest contributor of sediment to the Mississippi from any of its tributaries. The Missouri drains the Great Plains and includes flow from the Arkansas and Red River Basins. Due to the semi-arid environment and lack of vegetative cover to stabilize soils, there is a lot of erosion. You would think with the dry climate there wouldn’t be a lot of transport of the sediment, but apparently rains during the fall are sufficient to wash those sediments into the Mississippi. Or at least that’s what used to happen. Now with all those dams, the sediment is just sitting there filling up the reservoir behind the dam and starving the downstream wetlands.


The Geological Survey report says that only about 40 % of the sediment that used to be transported by the Mississippi River makes its way to the Louisiana coast now. No wonder there is such a big loss of wetlands. Add in all those levees in south Louisiana preventing the river from connecting with the floodplain wetlands and you get essentially what I would call an ecological disaster in the making. Here’s something even worse though, although the Missouri River provides the lion share of sediment to the Mississippi River, it only contributes about 12 percent of the water. Half of the water going into the Mississippi comes from the Ohio River. Well of course, there is a lot more rain in Ohio, Illinois, Indiana, Kentucky, Pennsylvania and West Virginia through which the Ohio River flows than the states through which the poor old Missouri River flows (Montana, South and North Dakota, Nebraska, Kansas and Missouri).  But you know what exists along the Ohio River – lots of farms with soybeans and corn and lots of farms with cows and pigs and other animals. What with all the fertilizer and manure runoff, the Ohio is the largest contributor of nitrogen to the Mississippi River. If you have been reading my posts on the Clean Water Rule, you will know that wetlands are a great means of removing nitrogen from water. You disconnect the river from the floodplain and wetlands and all that nitrogen goes down and empties into the Gulf of Mexico. What happens next is famous – the Gulf of Mexico dead zone. All this nitrogen pouring into the Gulf results in a massive growth of phytoplankton which depletes the oxygen in the water and results in fish kills. The Geological Survey report said that in 2002 the dead zone in the Gulf of Mexico was as large as the state of Massachusetts.


So there you have the result of a river not being a river anymore. Dams exist on so many of our major rivers and have forever altered the landscapes downstream. I will be looking at the scientific literature on dams over the next few months and writing about the impacts to water quality and morphology of landforms.