All posts by Waterblogger

The author has 35 years of environmental experience primarily with oil and gas and mining development, abandoned mines, and water issues in the private and public sector. A colleague once described the author as being a member of every weird water group in the West. A former Department of the Interior employee, the author received the Department's highest award for Distinguished Service in 2015.

Ocean Salinty and Climate Change

Ocean salinity is not a topic people often think about when it comes to climate change. After all why in the world would the salinity of the oceans change just because human produced greenhouse gases like carbon dioxide are accumulating in the atmosphere and the ocean? There’s a simple answer to this question though and I explained it in a detailed blog post about six years ago. You can read it at your leisure ( https://waterblogger.org/general-information/ocean-salinity-climate-change/  ). The short answer for the sake of brevity in this post is that greenhouse gases are causing the atmosphere to warm and warm air holds more moisture resulting in increased rainfall. If the amount of rain exceeds the amount of evaporation then a body of water becomes fresher and if there’s more evaporation than rain the water becomes more saline.

 This is all measurable and scientists have been measuring atmospheric water vapor since the 1970’s. It is raining more over the Pacific Ocean where there is already a lot of warmth with accompanying atmospheric moisture and it is raining less in the mid latitudes of the Atlantic Ocean. The Pacific Ocean is becoming less salty and the Atlantic Ocean saltier. Scientists in fact have been measuring the very dickens out of the oceans saline content. There are measurements through the Soil Moisture and Ocean Salinity (SMOS) satellite system and ARGO’s 2000 plus ocean based floating instruments. The latest 2021 International Panel on Climate Change report entitled Climate Change: The Physical Science Basis indicates that between 1950 and 2019 trends in near surface ocean waters have shown strengthening of the contrast between high and low salinity areas of the ocean. The report quantifies the increase in contrast as 0.14 parts per thousand. This is up slightly from the 0.13 parts per thousand reported in the 2013 IPCC report of the same name.

So what if some parts of the ocean are getting saltier and others are getting fresher? Who cares? Well scientists are concerned that changes in salinity will affect the density of ocean water as higher saline content results in denser water while fresher water is less dense. Ocean density is already being impacted by temperature changes. Cold water is denser than warm water. Certain deep water circulation patterns in the oceans are dependent on dense surface water sinking in the polar regions, for example the Atlantic Meridional Overturning Circulation (AMOC). AMOC brings warm surface water from the equatorial region of the Atlantic Ocean to the northern Atlantic where it cools, sinks and is transported back towards the equator. It’s like a big conveyor belt in the ocean. Scientists say that AMOC impacts the climate of the Northern Hemisphere but they seem quite uncertain as to how. They suspect it keeps conditions a lot warmer in the Northern Hemisphere than it would otherwise be. But all they really know is what is measurable and what is measurable is that AMOC is weakening. This makes sense if polar waters are warming and denser saline waters in the middle latitudes of the Atlantic are not being transported to the poles breaking the chain of the Atlantic Ocean circulation. If you live on the east coast of the United States you are probably familiar with AMOC as it includes the Gulf Stream which moves warm water from the Gulf of Mexico along the coast of the United States and Canada then on up to the Northern Scandinavian countries. Scientists are also uncertain as to what exactly is going to be the result of a weakening AMOC. There is of course a lot of speculation by researchers often based on what occurred in the geologic past when AMOC weakened. The IPCC report though does not take a position on the veracity of the various studies purporting to know exactly what happened when AMOC weakened in the past nor are they even a hundred percent sure if the weakening of AMOC is being caused by climate change. The IPCC report says that the record is too short to determine if weakening of AMOC is natural variability or driven by climate change. So I won’t speculate either, I’ll leave that to the popular press.

Sea Level Rise from Climate Change

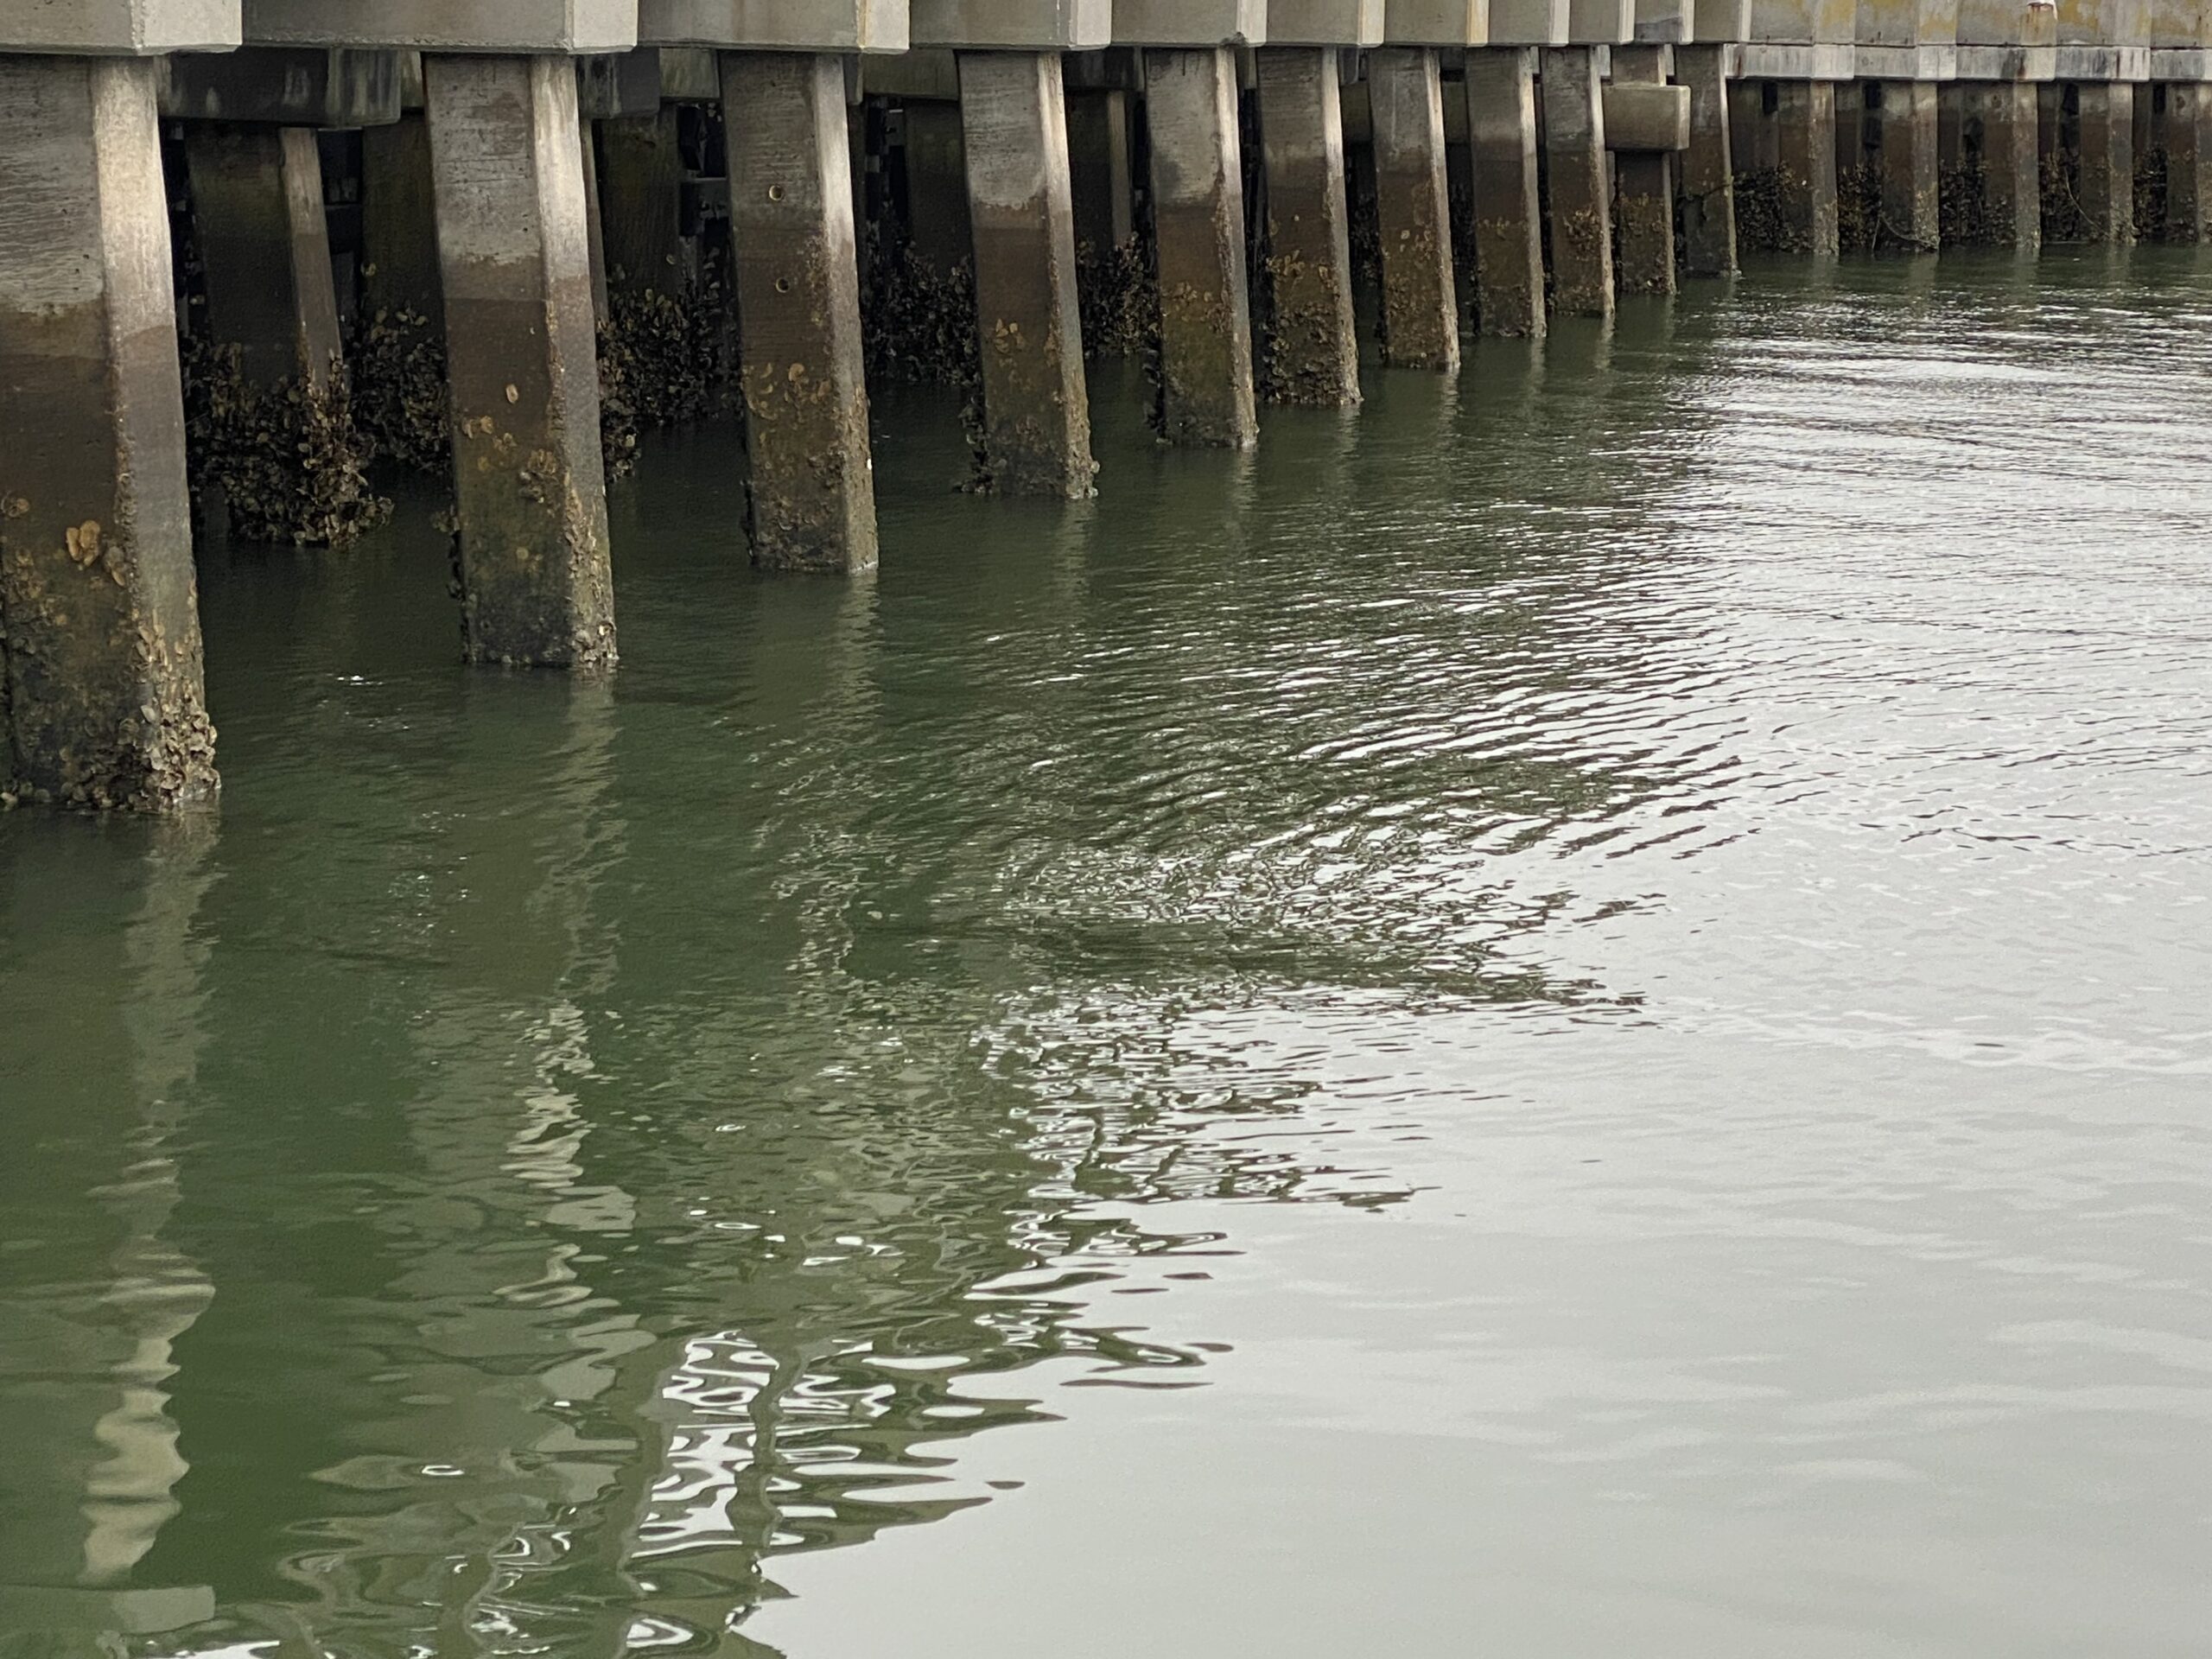
High water marks on a bulkhead

I read a story in the newspaper a few weeks ago about how the governor of Florida was visiting Miami in order to start the long process of providing protection from sea level rise to the low lying city. It was an interesting article; because in addressing the issues caused by sea level rise, like coastal inundation and flooding, he wouldn’t let the words climate change pass his lips even though the issues have expensive solutions like sea walls and drainage infrastructure. I’m not a political person but it seems strange to me that the guy won’t address the root cause of the problem and is only interested in temporary fixes. Sea level rise is becoming an acute problem all up and down the eastern seaboard of the U.S. wherever development has occurred along the coast. I live on an island where gauges to measure sea level have been installed to track the inevitable encroachment of the ocean. I’m afraid our community won’t exist in 50 years as no manner of temporary fixes will keep the island from disappearing.

Six years ago I wrote a blog post on the rising oceans (https://waterblogger.org/general-information/sea-level-rise-climate-change/ ). At the time scientists used satellite measurements to show there was a 0.03 inch yearly rise of sea level as the result of greenhouse gas emissions. Increased monitoring since then has produced a lot of new and better data, so let’s take a look at what the just released 2021 report from the United Nations International Panel on Climate Change Climate Change 2021: The Physical Science Basis has to say about sea level changes.

Here are the yearly sea level rises given in the 2021 report:

PeriodAverage Rate of Sea Level Rise in Inches per Year
1901 – 19710.05
1971 – 20060.075
2006 – 20180.15
Data from 2021 UN IPCC Climate Change 2021

What can we make of this new data? Simple math indicates that over the last 12 years of monitoring sea level has risen 1.8 inches and the total sea level rise from 1901 to 2018 is estimated at close to 7.9 inches. My last blog post based on the 2013 IPCC report on the physical science basis for climate change had an estimate of a 7.5 inch rise over the time period between 1901 and 2013. So we’re not talking about a huge increase in 8 years, but you can see from the table above that a continuous sea level rise is going on and that the rate of the rise is increasing on a yearly basis.

Why is sea level rising so quickly? Sure glaciers are melting and the Greenland Ice Sheet looks like swiss cheese because it has so many holes in it, but according to the 2021 IPCC report glacial melt has only caused about 41 % of the sea level rise between 1901 and 2018, although it is projected to increase as the loss of ice sheets is really beginning to take off and now accounts for 35 % of the sea level rise that has occurred between 2006 and 2018. The other reason for the sea level rising is simply good old fashioned thermal expansion. When you heat water, it expands. The 2021 IPCC report estimates thermal expansion is causing 38 % of sea level rise.

Other factors playing into higher sea levels are density and circulation changes in the ocean; however the 2021 IPCC report fails to quantify their contribution. I find it hard to believe because there are a multitude of other facts and figures given, but really the report just doesn’t say. There’s often a failure to communicate in the IPCC report caused chiefly by omissions like this one but also because so many different time periods and measurements are compared. It’s a hard slog to get through the whole report and garner any useful information. My literary critique aside, the changes caused by thermal expansion (thermosteric changes) and density changes from increased salinity (halosteric changes) are lumped together in the 2021 IPCC report as “steric sea level change.” These two changes actually should be working at cross purposes to each other, as greater density decreases volume whereas higher temperatures increase volume. I would take exception to how they are presented in the report, except in reality the halosteric changes are negligible.

So this is probably more complex than you ever thought and then to put even more of a spin on things (excuse the pun) sea level rise is not the same everywhere due to the earth’s rotation and gravity. In other words your sea level rise in Thailand is not going to be the same as it is in say New York City because water is sloshing around and mounding up differentially.

What is causing the sea level to rise is probably not as important as the projections in the 2021 IPCC report for future changes in sea level. The 2021 IPCC report provides two different calculations for future sea level rise: one projection is for the scenario of greenhouse gases being substantially reduced and the other is for a scenario where they continue to be emitted at high levels. Compared to the time period between 1995 and 2014 calculations show that in 2150 global mean sea level will rise by about 2 feet for the low emissions scenario and by 55 feet in the high emissions scenario. Unfortunately the world is now beyond the tipping point of totally eliminating sea level rise because heat in the surface of the ocean is slowly circulating into the deeper parts of the ocean and will be retained there, causing thermal expansion for thousands of years to come.

Ocean warming -climate change

I wrote my first blog post on ocean warming in 2016 (https://waterblogger.org/general-information/increase-in-ocean-temperatures-climate-change/). Almost six years have passed so let’s take a look at the state of the science in determining how our planet’s oceans are responding to the additional heat being transferred to them from the atmosphere. Conveniently the latest report from the International Panel on Climate Change (IPCC) just came out in 2021. It is entitled Climate Change 2021: The Physical Science Basis and is written in a much different style than the last IPCC report of the same name issued in 2013, because the science of climate change has grown. There’s a lot more certainty among scientists about what green house gas emissions from human activities are doing to our planet because there has been substantial data collection from a global network of monitoring systems over the last decade. Even the climate models have been updated and the predictions are now more useful. The bulk of the 2021 IPCC report is geared toward risk. In other words what is going to happen to this planet if it continues to warm and more importantly to readers of this blog, what is going to happen to the oceans?

The report uses a period between 1850 and 1900 as a reference period for comparison to today’s temperatures. You may recall those years were the beginning of industrialization. Scientists can now say definitively that global surface temperatures in 2021 are 2.1 degrees Fahrenheit higher than the time between 1850 and 1900.    

I wrote about ARGO in my very first post on how warming is affecting the oceans (https://waterblogger.org/general-information/oceans-and-climate-change/  ). ARGO is a system of floating scientific instrumentation deployed in the oceans around the world. The instruments measure, among other things, ocean temperature. The array of monitors has helped scientists determine the ongoing increases in ocean heat content in at least the upper 6500 feet of the ocean where measurements are being taken. Below 6500 feet there’s just not much data. But in the upper 6500 feet things are really warming up because these are the ocean depths where the ocean is storing heat from the atmosphere. Back in 2013 studies estimated that 90 % of earth’s energy caused by global warming since the 1970s is being stored in the ocean. New calculations say 91 %. Not much change there, but ARGO has been able to further refine for climate scientists where among the various depths of the ocean heat storage is concentrated. As you can imagine the first 3000 feet of the ocean is taking the big brunt of the action with 61 % of the total. This is important to realize because mixing and transfer of heat among the ocean layers is very slow. Later on in this blog post I’ll tell you why this is so important, but first a few more facts and figures for you from the report.

As everyone knows by now the three main greenhouse gases that are drivers of climate change are carbon dioxide, methane, and nitrous oxide. Carbon dioxide, which is in large part responsible for warming temperatures, is being exchanged and buffered by the ocean. Buffering is when carbon dioxide interchanges chemically with the water at the ocean’s surface to form a new compound – a weak carbonic acid. The ocean is taking up not only most of the heat from the atmosphere but is at the same time storing and reducing the amount of carbon dioxide. Carbon dioxide increases have been measured to be about 1.56 ppm a year over the last 61 years. During this time the accumulation of carbon dioxide in the atmosphere has remained about the same – 44 %. Why? Because the carbon is being taken up by the oceans and by the plants and soils of the planet. The circulation within the ocean slowly moves the carbon from the surface into deeper parts of the ocean.   

Scientists measure carbon in PgC. One PgC is equal to a billion metric tons of carbon. That’s a lot. The calculation of the cumulative amount of carbon dioxide from human activities that has been stored in the ocean is about 105 PgC. Do the math. Total human emissions of carbon dioxide are estimated to be 450 PgC. So the ocean is taking up 23 %. The fascinating thing that has been calculated in the 2021 IPCC report is when exactly the ocean will lose its buffering capacity for carbon dioxide. This is a mere chemical calculation, nothing special. Here’s the result: the ocean should be able to uptake carbon dioxide from the atmosphere through 2100, but its capacity to buffer will start decreasing around 2050.

What does this mean? It means that more carbon dioxide will remain in the atmosphere. For decades half of carbon dioxide has been taken up by the ocean and terrestrial carbon sinks and has slowed warming of the atmosphere. In 2050 the atmospheric temperatures will start to rise. You think its hot now, just wait.

And for the oceans? Average ocean temperatures today have increased by 1.6 degrees Fahrenheit from the reference period of 1850 to 1900. Since the 1970s, heat transfer to the oceans has increased by 0.28 – 0.55 yotta joules. No that’s not lotta joules; it’s yotta joules. Although it seems like a lot of joules to me. This a very large number, greater even than my calculator can handle. Take 0.28 and add 24 zeroes behind it. The 2021 IPCC report estimates that in the future ocean heat is likely to increase by 2 to 4 times that amount and 83 % of the ocean surface will warm over the 21st century. And here is what I told you earlier that I’d reveal later in this post. Even if green house gas emissions are drastically cut back, ocean warming will continue until 2300 because of the slow circulation between the upper and lower ocean depths.

So there you have it, the dystopian future of the oceans is sealed.

First Contact: Climate Change

I can envision the future when aliens first arrive in 2150 to contact humanity. Gyzzzzlbex and Azzterixx stop at the United Nations building in New York City for a meet and greet.

            Gyzzzzlbex looks around and says, “Hey Azzterixx I don’t remember all this water covering up the city. I know it’s been two hundred years since we last visited this planet, but I’m sure there wasn’t this much water here then.”

            Azzterixx replies, “And where are all the people? I didn’t see a soul when we were on the way down here in our space ship. This planet was heavily populated when we last visited.”

            “Maybe they killed themselves off with those nuclear bombs they were testing in the desert when we had that hard landing in Roswell, New Mexico.”

            “Nah,” says Azzterixx, “My monitor doesn’t show any radiation.”

            “Well maybe there’s something here in the United Nations headquarters that will tell us what happened.”

            The two aliens look around in the various rooms and find a library.

            Azzterixx picks up a weighty tome, browses through it, then says, “Well look here Gyzzzzlbex, this document says that it is unequivocal that humans have warmed the atmosphere, ocean and land of this planet through release of green house gases and that there have been widespread and rapid changes to the atmosphere, oceans, cryosphere and biosphere as a result.”

            Gyzzzzlbex walks over to where Azzterixx is standing and tries to read over his shoulder. “What is that big book you are quoting from?”

            Azzterixx says, “It’s called Climate Change 2021: The Physical Science Basis. It’s by some panel of experts here at the United Nations called the International Panel on Climate Change. And holy cow it is 4000 pages long.”

            Gyzzzzlbex says, “How about turning the page there Azzterixx.”

            Azzterixx does so and they both inhale sharply.

            “So that’s what killed them all,” says Gyzzzzlbex.

            “Yes and they calculated it all out in this report. Amazing. They knew if they didn’t drastically cut green house gas emissions that the global surface atmospheric temperature could rise by as much as 12 degrees Fahrenheit by 2100. How sad. Well I guess our mission here is done.”

            As the aliens turn to leave Gyzzzzlbex says, “I wonder why they did nothing to stop green house gas emissions, knowing what they did?”

            I wonder too. I read the news coverage of the recent United Nations Climate Summit in Scotland which reported of a consensus among scientists and environmental organizations that the agreement reached there by some 200 countries will not be enough to mitigate greenhouse gases impacts on our climate. It’s been since January 2016 that I’ve written anything on how climate change is impacting the oceans, so I thought I’d take a hard look at the scientific research presented by the IPCC report on Climate Change: The Physical Science Basis just issued in 2021 versus the report by the same name from 2014. I wrote four posts on climate change in 2016 that covered:  ocean temperature changes, sea level rise, and ocean salinity. So I’m going to follow that process again in this blog to let long time readers catch up with the current science. Here is a link to the first post I wrote in 2016 (https://waterblogger.org/general-information/oceans-and-climate-change/ ).

Definition of the Waters of the United States: Version 3.0

Here we go again. Possibly the most frustrating and boring occupation on the face of the earth is being a regulation writer for the U.S. Environmental Protection Agency (EPA). These poor suckers can spend an entire career writing and rewriting the same regulation. I don’t know what sad soul is stuck with yet again rewriting the regulation for the definition of the Waters of the United States but if I were them I’d start looking for another job, because this won’t be the last time. This regulation is way beyond controversial. For a synopsis of the history of the regulation check out my 2018 post here.

On June 9, 2021 the EPA and the Department of the Army (under which resides the Army Corps of Engineers (ACOE or Corp) that administer the Clean Water Act 404(d) permit program) once again announced their intention to revise the definition of the Waters of the United States (WOTUS.) In 2020, the Trump administration revised a 2015 Obama era WOTUS regulation, so the Biden Administration has decided that it needs to revise the regulation too, because just too many projects impacting ephemeral streams and ditches are moving forward. Ephemeral streams being those that only flow briefly during and after localized rainfall. Ditches are simply man-made structures carrying runoff. Ephemeral streams and upland ditches were exempted from regulation in the 2020 version of the rule. The EPA was sued in 2021 by the Pueblos of Laguna and Jemez in New Mexico because just about every contributing stream to their water supply is ephemeral. It is very dry in their part of New Mexico and they have valid concerns about projects off reservation that might be impacting their water supply. The pueblos want ephemeral streams to be redesignated as WOTUS for protection of the waters they use for domestic and agricultural purposes. There’s a bunch of other lawsuits too from an assortment of state governments, including New Mexico, and from the Conservation Law Foundation and other environmental groups. This is all standard procedure now after a regulation is issued. There were lawsuits after the 2015 regulations were issued as well.

            This is really all about the Clean Water Act 404 (d) program. The EPA is responsible for revising regulations under the CWA but the ACOE is charged with administering section 404 (d) of the CWA and issuing permits for any construction or dredging in areas that are considered WOTUS. The ACOE supported the EPA’s intention to revise WOTUS by assessing how the 2020 regulations have impacted their permitting program. They filed a Memorandum for the Record on June 8, 2021 with 165 pages of supporting documentation of their analysis.

            Here’s a little bit of background for you so you can understand their analysis. Before a member of the public submits a permit application, they can seek a determination of whether their project is actually within a WOTUS and receive what is called a jurisdictional determination.  There are two types of determinations: 1) approved jurisdictional determinations and 2) preliminary jurisdictional determinations.

            An approved jurisdictional determination is an actual official document giving the ACOE’s view of whether WOTUS exist within a project area. A preliminary jurisdictional determination allows an applicant to waive the jurisdictional decision-making process of the ACOE and go right to the permit decision. In the case of a preliminary jurisdictional determination, the ACOE is not making any determination of whether a WOTUS exists in a project area and they issue a general or individual permit based on the permit application. In other words, the project proponent is assuming there’s WOTUS within their project area when seeking a preliminary jurisdictional determination. It’s not at all necessary for a project proponent to request a jurisdictional determination in cases where the project isn’t regulated under the CWA or is exempt and indeed the ACOE issues many general permits that have no jurisdictional determination. I know this may sound like your typical government bureaucratic bullshit, but it’s how the Corp does things and they keep track of it. So as part of their analysis of how the 2020 regulations were impacting their permitting process, the ACOE checked how many approved jurisdictional determinations they’d made versus preliminary jurisdictional determinations then compared them to the numbers issued under the Obama regulations and the pre-Obama regulations. 

            Here’s what the ACOE found:

            1) Under the 2020 regulations 71 percent of approved jurisdictional determinations found there were no WOTUS within the project area. Under the 2015 regulations 46 percent of these types of determinations found no WOTUS within a project area. Most of the waters being assessed and not meeting WOTUS criteria were ephemeral streams or wetlands excluded under the new adjacency requirements in the 2020 regulations. Ditches were a smaller percentage of water resources not determined to be WOTUS. 

            2) Since the 2020 regulations became effective the number of approved jurisdictional determination requests has gone up by 116 %, meaning that permit applicants are no longer assuming that WOTUS exists within their project area.

            3) Based solely on examination of approved jurisdicational determinations, the number of permits required to be issued has greatly decreased compared to the numbers issued prior to 2020. There were 338% more permits issued under the Obama regulations and 412% more under the pre-Obama regulations.

            As you can see the 2020 regulations have had some big impacts and they are obviously not ones that the new Administration is comfortable with maintaining.             I will be following, as I’ve done in the past, the writing of the new regulations, so look for future updates in this blog.  

The Polluting suburbs

Aerial view of Silver Spring, Maryland – a suburb of Washington, D.C.

Have you been to Washington D.C.? It’s a favorite tourist destination for many. Most people who visit the city confine themselves to the National Mall where the monuments and historic sites can be seen.  The downtown area is similar to other major cities, with extensive office blocks, condominiums, and small businesses like restaurants and retail stores, however Washington, D.C. is unique in never having had major industrial activity like manufacturing or refining as its economic engine is the federal government. Few who don’t live there realize the extent of the city’s surrounding suburbs. Urban sprawl stretches west to Manassas, Virginia, south to Fredericksburg, Virginia, north to Frederick and Baltimore, Maryland, and east to the Chesapeake Bay. The vast suburban enclaves wrapping themselves around the city’s core choke off the natural processes of the water cycle with their immense impervious surfaces of concrete, asphalt, and roof tiles. What is this unnatural environment doing to our precious water resources? A good look at the impact of this overdevelopment can be found in the 2019 U.S. Geological Survey (USGS) Scientific Investigation Report (2019-5092):  Sediment and Chemical Contribution Loads in Tributaries to the Anacostia River

            The Anacostia River flows through Washington, D.C. and empties into the Potomac River. The USGS study is part of a larger scientific investigation of the Anacostia River’s pollution sources.  The U.S. Environmental Protection Agency set Total Maximum Daily Load (TMDL) values for the Anacostia River in 2003 for 16 different pollutants. The goal of setting TMDLs is to make a water body comply with a determined use, which in this case is to make the Anacostia River both swimmable and fishable – a tall order even for a city without a lot of industrial activity. The few industrial sources of contamination have been identified. They consist of a power plant, a gas plant, a bulk fuel storage area, and a couple of city landfills. These sources have been studied and are well understood. Most of them now have control measures installed to prevent future pollution to the river.  Contaminated sediments in the Anacostia from these sources have been pinpointed and singled out for removal so that  they will no longer be a continuing catchment of contaminants polluting the river far into the future. However the question becomes: will the water in the Anacostia River meet the TMDLs set by the EPA after the removal of these old contaminant sources or will the urbanized environment just continue to pollute the river and make TMDLs unachievable?  In other words, can the river be made clean again? Will people ever be able to safely eat fish from the river? Will they be able to swim and recreate in the river without concern?  

            Part of the continuing pollution of the river comes from the city itself. Storm and sewer drain studies have shown how the run-off from the city’s streets and yards are contributing to the pollution of the river. See my last post on Are Cities a Point Source of Pollution (Are Cities A Point Source of Water Pollution?)  But what about the urbanized areas surrounding the city?  What are their contributions? After all the entire city is small in comparison to the larger metropolitan area. The USGS study seeks to determine what the overall pollutant loads are from the tributaries of the Anacostia. The main tributaries with the largest basins and the greatest lengths are the Northwest Branch and the Northeast Branch. These branches are the two main tributaries which join to form the Anacostia River. The sources of both branches are in Maryland. The Northwest Branch drains much of the suburban areas of Montgomery County, Maryland while the Northeast Branch flows through Prince Georges County, Maryland. Both of these counties are monolithic representations of modern living with intense suburbanization, long streets clustered with parking lots, strip malls and shopping centers, residential developments with minimum space between houses and practically no yards, highways like the famous Beltway, and schools, churches and hospitals crammed into narrow spaces. Impervious surfaces, imposed by pavement and houses through which no rainfall can penetrate, vary from 20 percent in the upper portion of the basin to 50 percent at the confluence of the two branches. Both branch basins are densely populated. About 47 square mile out of a total 122 square mile area over which the tributary basins extend are covered with residential development. There are very few parks and any forest land is limited to that found along the riparian corridors of the branches. Just 13 square miles within the basins are forested. Agricultural lands make up only12 square miles. The two branches combined provide most of the water supply for the Anacostia River – 32,900 million gallons a year. They also contribute most of the sediment and the largest amount of Polyaromatic Hydrocarbon contamination flowing into the Anacostia. The USGS calculates that 89,000 grams of PAHs flow into the Anacostia from its tributaries every year. Seventy two percent of it comes from the Northwest and Northeast Branches. This is not surprising considering the urban nature of these two tributaries and the amount of sediment they are carrying. Out of 30,500,000 kilograms of sediment contributed by all tributaries to the Anacostia, 26,000,000 kilograms is coming from the Northwest and Northeast Branch with the Northwest Branch contributing the most. Considering that contaminants are primarily transported with fine grained sediment, it is not unexpected that the greatest amount of PAH contamination is coming from these two waterways.

            Completely surprising is where the greatest amount of Polychlorinated Biphenyls (PCBs) is originating from – Lower Beaver Dam Creek. This tributary to the Anacostia originates solely from Prince Georges County, Maryland. Its basin is fairly small – 14.9 square miles – but it has an outsize contribution of sediment to the Anacostia, nearly 4,500,000 kilograms a year. This amounts to 3.01 kilograms per year for every square mile. Obviously Prince Georges County needs to put some erosion control measures into place. Entrained within the sediment is a huge load of PCBs being carried along by the water in the creek.  The PCB levels in Lower Beaver Dam Creek are magnitudes greater than any other tributary to the Anacostia. The USGS calculated that stream water in the creek has an average concentration of 130 micrograms per kilogram. Compare that to Northwest Branch with 6.6 micrograms per kilogram. About half of the creek’s basin is covered in residential development. The impervious surface is estimated to be about 32 percent or 7 square miles. Forested land makes up only 3.5 square miles and agricultural land some 6.6 square miles.  There’s also a small amount of industrial use (less than 1 square mile.)  The source of the PCBs in the creek is not known. The total annual amount of PCBs calculated by the USGS as entering the Anacostia from its tributaries is 860 grams per year, seventy five percent of that is coming from Lower Beaver Dam Creek.

             So how is this all going to affect the ability of current measures envisioned to protect the Anacostia River by removing known sources of PAHs and PCBs in the river’s sediments? And can the Anacostia River ever meet the TMDLs set by EPA? Well I suspect that’s all up in the air right now, because Northwest and Northeast Branch and Lower Beaver Dam Creek as well as a couple of smaller tributaries solely originating within Washington D.C. (Watts Branch and Hickey Run) are exceeding the contaminant load allocations set for those water bodies under TMDLs, in some cases by a factor of 200. What new measures will have to be implemented to control and reduce contaminants coming from the Anacostia River’s tributaries? And how will Washington D.C.’s environmental regulatory agency get  cooperation from another state, in this case Maryland, to implement what could be costly and possibly disruptive practices to reduce contaminants that are essentially being introduced into waterways by suburban sprawl? If you want to know then look at the Chesapeake Bay Program where currently the state of Maryland is suing states upstream of the Susquehanna River that are contributing a huge share of the contamination to the Bay and doing little to prevent it.               It’s clear from the USGS study that suburban areas, with dense populations creating extensive impervious surfaces (e.g. parking lots and streets), are a significant contributor to the contamination of streams and rivers. The runoff from paved surfaces after a rainfall is washing contaminants off suburban streets and transporting them into nearby streams. Additionally the heavy flow of water caused by runoff is eroding stream banks, resulting in a huge amount of sediment with entrained contaminants being carried downstream and into our rivers. The lack of natural rainfall percolation through soils is resulting in a new contamination source – the suburbs.   

Are Cities A Point Source of Water Pollution?

You drive over them all the time and never even notice except if they have been poorly installed or have subsided into the pavement and your car tire hits them with a thud.  Manhole covers.  They are ubiquitous in the urban environment and are covering up a multitude of sins.  Below them lurks the city sewer system.  You may have visions of sewers being filled with rats and roaches; no place that you plan to visit, just a reality of modern life.  Most of the manholes are covering the storm sewers that drain a city of rainfall and snow melt.  The storm sewers in a new suburb are not connected with the wastewater sewers that empty from your sinks and toilets, but in many of our older cities in the United States such as Washington, D.C. some of the storm sewers are combined with the wastewater sewers.  I know you are thinking “Yuck” and me too.  In Washington D.C., sixteen of these combined sewers flow directly into the Anacostia River during storm events with loads of e.coli and fecal coliform because of the lack of capacity at the wastewater treatment plant. 

            The uncombined sewers that simply deliver storm water to the Anacostia River are not benign either.  Because of the wash of water during storm events and after snow melt, the sewers transport sediment washed from roads and green spaces like yards and parks, trash including glass and metal, and leaves and other organic detritus.  The sediments contain the urbanized contaminants of the city.  A type of urban contaminant you might find in storm sewers are Polychlorinated Aromatic Hydrocarbons (PAHs) that form as a result of incomplete combustion of fossil fuels in power plant emissions but also are emitted with car and truck exhaust.  PAHs are components of asphalt and automobile tires as well.  Simple tire wear on the streets of our nations and the existence of asphalt pavement results in a polluting source of contamination to our waterways.  Polychlorinated Biphenyls (PCBs) are another urban contaminant.  PCBs were used in all sorts of electrical equipment that supports a city’s electrical power grid:  transformers, capacitors, voltage regulators, and switches.  PCBs also were used in motor and hydraulic systems, insulation, oil based paint, and a whole host of other crazy stuff that are part of the urbanized environment.  Long banned for use, they continue to persist in urbanized areas because they don’t degrade to any extent.  Dioxins which are also formed from fossil fuel combustion, pesticides such as DDT and chlordane that once were widely used throughout cities for pest control, lead from bridges, corroding metal surfaces, paint, and old combustion of lead gas, arsenic from pesticides and fertilizer used to treat wood in outdoor decks and walkways, and mercury from combustion of coal and oil in power plants are all urban contaminants.

            When storm water and snow melt clears the streets of a city, all of these urban contaminants flow into and through the sewer systems and discharge directly into our rivers.  It is hard to tell in most cities to what extent urban living is contributing to the pollution of our waterways, because in addition to city contaminants there is also the contribution of pollutants from run-off at both old and new industrial sites.  These industrial sites, if still operating, are often considered point sources of contamination under the Clean Water Act and not just from effluents that might be leaving the sites via pipes and culverts, but from storm water runoff at the property itself.   Washington, D.C. though has no large scale industrial sites contributing to the Anacostia River; there are just a few old city landfills, a couple of power operators, and a few petroleum storage areas that are part of any city’s urban legacy.  The few military bases are old, really old, (for example the Navy Yard was established in 1799) and they were not major industrial operations.   So I was excited to see as part of the Anacostia River Program, which promises to make the water in the river fishable and swimmable, a study was being conducted on the contribution of upgradient sewer systems to the contaminated sediments at outfalls flowing into the river.  Here was a chance to define to some extent what the contribution of contamination by the city itself is to the Anacostia River.  I read eagerly through the “Manhole Sediment Investigation Report” completed back in December 2019. 

            Outfalls along the Anacostia were sampled for contaminants as part of an earlier study.  Outfalls of the sewer system make little delta like formations where a pipe or culvert drains water into the river.  Sediments from 16 of the combined sewer outfalls and 35 of the storm water only outfalls are considered contaminated.  The idea of the study was to use manholes to collect sediments out of the sewers to assess the level of contamination being contributed to the river by upgradient sources.  Washington D.C.’s Department of Environment and Energy wants to clean-up the contamination in the river to achieve its goal of making the river safe for swimmers and fishermen, but is concerned about possible continuing upgradient sources of contaminants that could re-pollute the river after the cleanup. 

            One hundred fifty seven manholes upstream of the contaminated outfalls were identified for inspection. Only 38 of the manholes were actually sampled for two primary reasons: 1) many of them could not be opened, and 2) many lacked enough sediment to be chemically analyzed.  The lack of sediment in many of the sewers is not surprising because think of how storm events proceed.  A good one washes the streets clean with a torrent of water which enters a storm drain aligned with a multitude of other storm drains and the rush of water down the sewer pipe and into the river is turbulent and almost violent.  Everything is blasted out of the sewer including most of the sediment.   

     Here’s what the study concluded from the 38 samples taken.  All sewers that discharge to the Anacostia are washing contaminants into the waterway.  It wasn’t possible to directly correlate the levels of contaminants found in sediments taken from the sewers to those from the outfalls.  This is because the sediments taken from the manholes contain a much lower level of organic carbon, clay and silt than the sediments at the outfalls. Such low levels are a result of the turbulent flow that carries the small particles, of which these types of sediments are composed, out of the sewer and into the waterway.  Contaminants preferentially absorb onto organic carbon, silt, and clay.  However, where manholes provided enough sediment for chemical analysis, they were found to contain notably higher levels of contaminants compared to the background of these contaminants in the river.  Many of the contaminants from the sewers are 20 to 50 times higher than background in the river sediments. 
            Interestingly some of the highest levels of PCBs from the sewers were not where you would expect them to be – near the power generation sites – but are instead in the area upstream of the Washington Channel and Tidal Basin, where there are no known contaminated sites.

            Because of the limited sampling, the study doesn’t provide an overall picture of how much the city is contributing to the pollution of the Anacostia River, but the results are alarming enough for the study participants to recommend further upstream manhole sediment sampling to see if the sources of the contamination in the sewers can be tracked down and identified – a difficult and expensive undertaking.   It’s questionable as to whether individual sources could ever be found.  Perhaps urban contaminants are so ubiquitous in a city that vast water management measures will need to be taken similar to the ones now being implemented on the Chesapeake Bay where wide land use issues are contributing to the nitrogen and phosphate pollution.  In order to meet Clean Water standards, will cities in the future have to implement actions like rain gardens, green roofs, installation of pervious pavement, runoff controls, and water treatment at outfalls.  I suspect this small manhole sediment study has opened the eyes of many environmental regulators tasked with keeping our rivers clean of pollutants.  The study verifies that it is not just contaminated sites like landfills and power plants that are polluting our urban rivers; it is also the city itself.        

Repeal of the Clean Water Rule

The Administrator of the U.S. Environmental Protection Agency (EPA) and the Assistant Secretary of Civil Works for the U.S. Army (essentially the Corps of Engineers since they implement portions of the Clean Water Act) signed a “Recodification of a Pre-existing Rule” on September 12, 2019.  According to the summary in the text, the Recodification “repeals” the Clean Water Rule of 2015.  I have written multiple times in this blog on the complicated regulatory and legal issues surrounding the Clean Water Rule of 2015.   For background check out these links: https://waterblogger.org/water-quantity/waters-of-the-united-states/

          The item being recodified is the definition of the “Waters of the United States” (WOTUS) under the Clean Water Act (CWA), or in simpler terms, what bodies of water are regulated under the Clean Water Act.  In a nutshell the Clean Water Rule of 2015 was seen by many states as a water grab by the federal government, because states have traditionally managed waters within their boundaries and the new definition expanded the water bodies covered by the CWA.

          However the definition of WOTUS which existed prior to the Clean Water Rule of 2015 was difficult to implement and a number of regulatory decisions made by federal agencies to include wetlands and water bodies adjacent to tributaries as WOTUS were appealed by landowners through the court system.  A couple of these cases reached the Supreme Court.  The Supreme Court directed the federal agencies to provide a resolution as to what bodies of water were WOTUS.  As a result the EPA rewrote the regulations and used a science based approach to do so.  The new regulations published in 2015 were dubbed The Clean Water Rule. 

          These rewritten regulations were a spectacular failure and since 2015 there has been an ocean of litigation.  Lawsuits were brought against the Clean Water Rule by a group of 28 states.  This litigation resulted in judgments that stopped implementation of the Rule in those states.  Those 28 states have been operating under the original regulations ever since.  The other 22 states have been operating under the new 2015 Clean Water regulations. 

          The purpose of the Recodification is to reinstate the original regulations which existed before the 2015 Clean Water Rule was implemented.  With the Recodification all 50 states will be operating under the original regulations – at least until whatever new litigation gets underway.  The Recodification text gives four reasons that support the repeal.

          First, a Supreme Court decision dictated that the EPA and the Corps of Engineers needed to define the limits of their authority to implement the CWA.   The 2015 Clean Water Rule failed to do so.  (A lot of states envisioned that the lack of a limitation could lead to every drop of water in the U.S. being subject to the CWA.)

          Second, the 2015 Clean Water Rule didn’t recognize, preserve, and protect the primary responsibility and rights of the states to manage their own land and resources.  (The western states and the big agricultural states jealously guard their right to manage water within their state boundaries so the Clean Water Rule, by expanding the federal government’s regulatory authority over water bodies, really riled them up.)

          Third, without any authorization from Congress the 2015 Clean Water Rule provided a regulatory framework that could have led to encroachment on the state’s land use planning authority.   (States were concerned about traditional state and local authority over land use activities like conversion of land for agricultural and other uses.)

          Lastly, the 2015 Clean Water Rule’s attempt to define the scope of a tributary or adjacent waters inclusion under the CWA resulted in some procedural errors and lacked adequate record support.  (Basically a couple of court cases said EPA didn’t meet the arbitrary and capricious standard under the Administrative Procedures Act.  It looked like the agency while writing the final regulations had just pulled a bunch of numbers out of a hat to define the distance a tributary or adjacent water had to be from a WOTUS to be included as a regulated water body.)

          The Recodification has not yet been published in the Federal Register so it is not yet being implemented.  It is also being called “Step 1.”  After the Recodification, “Step 2” will be implemented.  “Step 2” just happens to be a new Rule defining WOTUS.  This new rule published for comment in 2018 tries to simplify the definition of a “WOTUS” by making it a legal definition instead of a definition based on science.  A description of this new Rule can be found at this link: https://waterblogger.org/general-information/revised-rule-on-the-definition-of-waters-of-the-united-states/

          Stay tuned.  I’ll keep you up to date as the regulation winds its way through further trials and tribulations. 

PFAS in Water

PFAS is the new “It” organic chemical contaminant.  You hear about it in newspapers, in magazines, at environmental conferences and wherever environmental professionals gather to talk.  PFAS is not just one organic chemical but a whole suite of related organic chemicals and the acronym stands for per- and poly-fluoroalkyl substances.  There are dozens of these chemicals but in water only the per-fluoralkyl substances are important.

          The per-fluoroalkyl substances are chain like structures composed of a series of bonded carbon and fluorine atoms attached to a charged ion.  Scientists call the carbon and fluorine atoms the “tail” and the charged ions the “head”.  There are two main types of per-fluoroalkyl substances:  per-fluoroalkyl acids and per-fluoroalkyl sulfonamides.  Scientists, seemingly in order to confuse everyone, have given the per-fluoroalkyl acids the acronym PFAAs. 

          The two PFAAs which give us the most trouble are per-fluoroalkyl carboxylic acid and per-fluoroalkane sulfonic acids.  Of the per-fluoroalkyl carboxylic acids the one’s that are detected most in water are PFOA or per-fluorooctanoic acid and its cousin per-fluorooctanoate.  Of the per-fluoroalkane sulfonic acids, the ones that are detected most often are PFOS or per-fluorooctane sulfonate and per-fluorooctane sulfonic acid.    

          I know this is a jumble of acronyms and chemical names.  Here’s a handy cheat sheet to keep them all straight.

Cheat Sheet

          Really the only chemicals you need to remember are PFOA and PFOS, because they are basically non-degradable.  Yes that’s right, they are not degradable.  They are with us forever. Scientists even call them “terminal PFAS” or “terminal degradation products”.  The carbon fluorine bond is so strong that it is impossible to break it apart through natural degradation processes existing in our environment.  There are plenty of other PFAAs too.  But they are not generally found in water as they degrade into the “terminal PFAS.”  Ditto for the poly-fluoroalkyl substances. 

          There are lots of different PFAS that have been manufactured over the last 80 years.  As a result, PFOA and PFOS are found everywhere.  They are in the air, the soil, the water, the fish, the plants, and your blood.  In one study in 2015 supported by the Red Cross (authored by G.W. Olsen and others) a set of 616 blood donor’s plasma samples, representing the general U.S. population, was analyzed for PFAS.   Researchers reported PFOA levels of 1.1 micrograms per liter in the blood donor’s plasma and 4.3 micrograms per liter of PFOS.   Why in the world would anyone produce something like this and why in the world is it so ubiquitous in the environment?  This stuff is even found in the Arctic and Antarctic.    

          PFAS are chemicals that repel oil and water and reduce friction.  They have been used in non-stick cookware and in protective sprays to prevent spills and stains on carpets and upholstery.  They are also used in firefighting and firefighting training at airports and military bases because they can put out a jet fuel fire.  PFAS have been manufactured since the 1940’s.  The chemicals were never reviewed under the Toxic Substances Control Act (TSCA) because the law which was written in 1976 only required review and approval of new chemicals.  TSCA was rewritten to fix this loophole in 2016.  The U.S. Environmental Agency (U.S. EPA) worked with companies to phase out the manufacture of the problem PFAS chemicals back in 2002 so presumably new contamination sources no longer exist.

          The “terminal PFAS” – PFOA and PFOS – have a wide distribution in the environment because of the chemical nature of PFAS.  Remember the “tail” of bonded carbon and fluorine?  That tail acts to repel water and oil.  Remember the “head” of charged ions?  It mixes with water.  How crazy is that?  But these are the properties that this chemical was made for; it’s why those no stick pans in your kitchen work so well and clean up like a breeze.  But where this chemical has been spilled or disposed of in our environment, it results in all sorts of weird activity.   Where it is found in the vadose zone (the unsaturated area of soils and rock before groundwater is encountered) the “tail” properties cause it to attach to organic carbon and other organic contaminants in the soils.  At the same time, its negatively charged “head” repels the negatively charged soils.  This makes the “head” free and available for mixing with water.  During and after a rainfall, water percolating through the vadose zone attaches to the “head” and drags the chemical down into the groundwater zone below with it.  Unless you get rid of the PFAS in the vadose zone, you have an ever present source for water contamination.

          Once PFAS moves into the groundwater, it moves fast because PFAS’s chemical properties give it high solubility and low retardation in the aqueous environment.  Groundwater can discharge into surface water, and before you know it, PFAS is down the river.  If you have a private or public well into groundwater near a PFAS spill or disposal area then it can get into your drinking water.  Drinking PFAS is not good for your health.  In 2016, the U.S. EPA set a drinking water health advisory for PFAS.  It is 70 parts per trillion.  This is a very, very small number and is based on protection of fetuses and breast fed infants.  Fortunately the EPA surveyed 4064 public water supplies individuals in the U.S. and found only a small number to be contaminated with PFAS.  Most of these systems are near manufacturing plants where PFAS was made and released into the environment or near military bases and airports where firefighting training has occurred.

          Quite a bit of research has been conducted over the past 10 years on PFAS and its’ interactions in the environment, including on-going studies into the complexities of the chemical’s interactions in the natural environment.  I’m always floored by the fact that scientists are doing the research on these interactions years after a chemical was first developed and put into use.  This is not the first time this has occurred.  Fifteen years ago the “It” organic chemical contaminant was MTBE or Methyl tert-Butyl Ether.  MTBE replaced lead in gasoline as far back as 1988.  What nobody bothered to look at back then was what chemical properties MTBE might have that would interact in a poor manner with the environment after it leaked from underground storage tanks at gas stations.  Like PFAS, MTBE is highly soluble in water.   And like PFAS it forms big plumes moving from the source of contamination through the groundwater to reach drinking water wells and surface water.  MTBE though, unlike PFAS, is readily degradable in the environment.   

          Failure to examine a chemical’s interactions with the environment prior to its widespread use has resulted in an entire industry of environmental remediation where costly soil removals and large scale groundwater recovery systems have to be installed and maintained.  The costs of such remediation can be exorbitant and the desire to recover these costs as well as damages for the contamination has led to lawsuits against chemical manufacturers and corporations using the chemicals.      

The Urban River

Anacostia River

Everyday tens of thousands of commuters in eastern Maryland get into their cars and drive to their jobs in Washington D.C. (D.C.).  They most often commute into the city via New York Avenue, Benning Road N.E., or Pennsylvania Avenue.  No matter what route they take, they have to cross the Anacostia River.  Most of the commuters probably don’t know the name of the river they are driving over or even give it a second glance as they weave through some of the worst traffic congestion in the country.  It’s not a big surprise why drivers ignore the river.  It is perhaps one of the worst looking water bodies in the country.  It is a wide, flat, slow moving, reddish brown, algae matted mess barely discernible as water.    

          The Anacostia has a small watershed of 176 square miles.  However the entire extent of the watershed is within the urbanized and suburbanized confines of D.C., Montgomery County and Prince Georges County, Maryland.  The Anacostia eventually flows into the more well known Potomac River near Hains Point and the Washington Ship Channel.  The Anacostia is one of the best examples in the country of a river where most of the environmental impacts are caused by the urban environment as opposed to past industrial waste disposal practices.  Although there are a number of contaminated sites along the river, they are mostly sites associated with urban living – municipal landfills, utility companies, and petroleum storage yards.  The only odd ducks are the military bases which are present in large numbers in the country’s capital.  But the two military sites located along the Anacostia had little industrial activity and most of it was long ago.

          The river’s chief environmental problems are suspended sediment which gives it that nasty brown color, nutrients like nitrogen which cause the algal blooms, and e. coli and fecal coliform.  The latter two contaminants are pathogens. Their presence in the river is due to a combined storm and wastewater sewer system which regularly overflows the Blue Plains waste water treatment plant, dumping untreated human waste into the Anacostia River.      

          The District of Columbia’s Department of Environment and Energy (DOEE) has been monitoring the Anacostia, along with all the other water ways in its jurisdiction, for years.  The agency produces regular reports on their findings.  Their most recent report in 2016 is entitled: The District of Columbia Water Quality Assessment Draft Integrated Report.  The report provides water quality data on the state of D.C.’s rivers and streams and outlines a program the DOEE has implemented to meet the tough goal of making all water bodies in the area swimmable and fishable.  According to the report, there are no current waters in D.C. which support all designated uses.  A “designated use” is a term that is used by environmental regulators to describe the activities people should be able to engage in a water body, like fishing and swimming.  So the Anacostia River is not an outlier.  Even Rock Creek, the beautiful stream that descends through Rock Creek National Park doesn’t meet its designated use of swimming because of e.coli or its designated use of fishing because of polychlorinated biphenyls (PCBs).

          The causes for water impairment in all of the water bodies of D.C. are myriad because of the urban nature of the surrounding land. Pesticides are abundant in soils because of past widespread spraying for mosquitoes and other pests, PCBs which were once used in electric transformers are everywhere, and polycyclic aromatic hydrocarbons (PAHs) as well as oil and grease wash off of the city streets. All of these contaminants enter waterways as a result of storm water flow.

          The Anacostia River has the same problems that all the other D.C. water bodies receiving storm water runoff have.  But in addition to contamination from the storm water inputs, it also has the problems caused by the old municipal landfills, utility operations, etc.  How can the effects of the two different sources of water degradation be separated?

          This is an important question because the Anacostia is the subject of a large scale river cleanup program prompted by the National Park Service which has administrative functions given to it by Congress for the National Park land along the Anacostia River and for the banks of the tidal portion of the river.  DOEE and the National Park Service have instigated a Remedial Investigation study under the Comprehensive Environmental Response, Compensation, and Liability Act (CERCLA) more widely known by the public as the Superfund Law.  The Anacostia River is also included under the U.S. Environmental Protection Agency’s (EPA) Urban Rivers Program.  Further the Anacostia River is a target for the Chesapeake Bay Program because the excess nitrogen and e. coli from D.C.’s combined waste water and storm water sewer system is contributing to the poor water quality in the Bay.

A number of programs have been implemented to improve water quality impairments from the combined sewer system.  D.C. Water, the water system operator in the city, has a long term control plan which involves the construction of four enormous underground tunnels to hold millions of gallons of the combined sewer flow so that it doesn’t overwhelm the wastewater treatment plant.  An upgraded treatment plant is also in the works, as well as a replacement program to separate wastewater and storm water sewers.  All of these activities are costing billions of dollars and should improve water quality in the Anacostia River.

          But those activities won’t solve the problem of existing contaminants like PCBs, dioxins, and pesticides found in the sediments of the Anacostia River.  According to the Remedial Investigation conducted under CERCLA, the sediments are the chief source of human health and ecological risks posed by the river.  The risks are attributed to the exposure of invertebrates, fish, and fish larvae to the contaminated sediment.  Fish larvae which come in contact with the contaminants are impaired in their ability to survive and grow.  Fish that do survive feed on contaminated invertebrates in the river and accumulate those contaminants within their tissues.  As a result, fishermen are advised not to eat what they catch.    

          The contamination is certainly there. There are hundreds of samples of sediment and fish with evidence of the contamination, but is the contamination from the old landfills, utility operations, and military bases or is it from the urban storm water flow that comes off the city’s streets and green spaces?  At this point the Remedial Investigation provides no answer but defers the issue to a follow-up report called a Feasibility Study. 

          The Remedial Investigation says there are 15 Combined Sewer System outfalls discharging directly to the Anacostia River during storm events because of the capacity problems at the wastewater treatment plant.  In July through September of 2017 there were a total of 153 releases from these outfalls with a volume of 390 million gallons.  Sediment samples from one of the outfalls showed high level of PCB and PAH contamination.  And those are the combined sewers. There are 60 outfalls of just storm water entering the Anacostia River. The report sites all of these outfalls as a source of “urban” background contamination, resulting in the entry of PAHs, PCBs, pesticides and even some metals into the river.

          The Feasibility Study will report on manhole sampling for the combined sewer outfalls and the storm water outfalls.  These samples should provide some very interesting data on what portion of the contamination in the Anacostia River is caused as a result of urban living.  The report will be one of the few studies to examine urban contamination’s contribution to the degradation of our streams and rivers.  The EPA has been aware of the problem for years and published its first guidance way back in September of 2002 on how to establish urban background contamination when examining Superfund sites.  EPA’s regional office in the southeast and the EPA’s Office of Research and Development are currently engaged in a study to determine urban background contamination in southeastern cities.  I will be posting in the future on the results of these studies which essentially will tell us how modern living is impacting our natural resources.