Tag Archives: Nutrients

Biogeochemistry of Nutrient Pollution

Yuck!

I have used the term biogeochemistry in several blog posts on nutrient pollution and have been asked to explain what this term means and what role biogeochemistry plays in nutrient pollution. Biogeochemistry is a mouth full, but if you dissect the word then you see that there are two prefixes attached to the noun chemistry – bio and geo. Bio is short for biology and geo for geology. Biochemistry refers to the chemical processes taking place within living things, for example the incorporation of nitrogen into a plant’s proteins and chlorophyll. Geochemistry on the other hand is the study of the chemistry of geological processes, such as, the behavior of nitrogen in water and soils. So biogeochemistry is the combination of the two.


To explain further, let’s follow through with the example of the biogeochemistry of nitrogen pollution. Did you know earth’s atmosphere is 78 % nitrogen? That’s good right? After all, living organisms on earth need nitrogen for use in daily metabolic functions. But plants including algae can’t directly use the nitrogen in the air. It’s kind of like that old maxim about the ocean – “water, water everywhere but not a drop to drink.” Nitrogen gas has to be converted into ammonia or nitrate in order for plants to be able to use it. Nitrogen fixation and nitrification are the primary processes of conversion.


Nitrogen fixation produces ammonia. The chief nitrogen fixers on the planet used to be bacteria. But of course now humans have gotten into the game. Nitrogen fixation occurs as a result of fossil fuels being burned in power plants and during combustion in car engines. The process called nitrification converts ammonia to nitrite and then on to nitrate. Nitrification is pretty much just carried out by single cell organisms like bacteria. Both nitrogen fixation and nitrification require oxygen.


These biogeochemical processes occur both in soils and in water. So in water bodies like lakes, rivers, estuaries and oceans, bacteria are busy converting unusable nitrogen into usable forms, which algae – just like terrestrial plants – can use to grow. There’s also another process called denitrification which is going on in soils and water that are oxygen deficient. A group of bacteria which prefer oxygenless environments are busy taking nitrate and converting it back to unusable nitrogen gas. The nitrogen gas formed by denitrification is then cycled back into soils and water where it is once again used in the nitrogen fixation and nitrification process. It’s just one perpetual do-loop and is called the “nitrogen cycle” by scientists.


Of course the algae require other nutrients like phosphorous to grow and they depend on sunlight for photosynthesis, but in coastal waters and estuaries, the growth of algae is only limited by the availability of nitrogen. This is because these little algae guys need 16 times more nitrogen than phosphorous to grow and ocean waters are low in biologically usable nitrogen compared to phosphorous. It’s the exact opposite for freshwater lakes and streams.  In general if you add a bunch of man-made forms of nitrogen from fossil fuel combustion, nitrogen fertilizers, farm animal manure, and human waste (from wastewater treatment plants) to estuarine and coastal waters then algae are going to thrive.


However there are all sorts of other biogeochemical interactions that can come into play which affect the availability of nitrogen compounds to algae in the water. Take phosphorous, it readily adsorbs onto sediments under normal oxygen conditions and is then not available to the algae floating around in the water. In this case, adding nitrogen to the water won’t result in excessive algae growth. However if a water body is lacking in oxygen then sediments will release adsorbed phosphorous back into the water. This is because adsorption of phosphorous in sediments is strongly dependent on the presence of iron – oxidized iron. Iron forms sulfide compounds in water bodies without oxygen. Phosphorous does not interact in the same way with iron sulfides in sediments as it does with iron oxides. Therefore in low oxygen zones, phosphorous is more available in the water to help algae prosper when there are sources of nitrogen pollution.


Iron is also needed by algae for photosynthesis. Iron is not very soluble in water so it has to combine with organic matter to be available to aquatic organisms. The amount of organic matter in low oxygen waters is higher than it is in water with normal oxygen levels, because well, a lot of things are dying down there in the no oxygen zone since most aquatic organisms need oxygen to survive. Increased iron is then available in the water to help algae grow.


Complicated right? And I haven’t even touched on the issue of silica and how it impacts the type of algae growing in a water body. The diversity of biogeochemical interactions within a water body is the reason why each one must be studied independently to determine how best to prevent nutrient pollution.

Gulf of Mexico Pollution

Can you imagine an area of pollution in the ocean which is the size of the state of New Jersey and where no marine life can live because there is too little oxygen in the water? You would think if such a place existed then it would be featured on the nightly television news and be in the newspapers on a regular basis. After all journalists flocked to the Gulf of Mexico when the oil spill from the Deep Water Horizon occurred in 2011 and it was reported in the media on a daily basis. But indeed such a large polluted area in the ocean does exist and it is located off the coast of Louisiana in the Gulf of Mexico. Perhaps journalists ignore its’ existence because there aren’t dramatic photos to show on the television like flowing oil from a borehole on the ocean floor or multiple oiled seabirds. In fact if you sailed right through this huge polluted zone on a boat, you would not even notice it, unless of course you tried to catch a fish.


The lack of oxygen in this area of the Gulf of Mexico is caused by “nutrient” pollution. Essentially water flowing down the Mississippi River is full of sediment, phosphorous, and nitrogen washed off the abundant farmlands in the central part of the United States. Phosphorous and nitrogen are called nutrients because they are used by living things for growth and metabolic functions. When all those nutrients in the freshwater river flow into the salty waters of the Gulf of Mexico, two things happen. Number one, the freshwater forms a lighter layer on top of the heavier salty water in the near shore environment of the Gulf. Number two, all those nutrients in the freshwater feed the algae living at the Gulf’s surface where the sunlight is abundant. This causes the growth of massive algal blooms. When the algae eventually die, they drop to the salty bottom layer of water. The decay of the algae uses up the oxygen in the bottom salty layer of water and produces a hypoxic or dead zone. (For more information on nutrient pollution follow this link https://waterblogger.org/water-quality/nutrient-pollution/ ).


Scientists have been measuring the extent of the dead zone in the Gulf of Mexico for over thirty years. The size of the dead zone has gotten larger and larger and in 2017 it grew to be the largest size ever – 8776 square miles. You are probably thinking, why isn’t someone doing something about this huge dead zone in the Gulf of Mexico, like the U.S. Environmental Protection Agency (EPA), isn’t that their job? Yes it is, and the agency does have the regulatory tools under the Clean Water Act to require waters of the United States to meet Water Quality Standards. But so far, and despite recommendations to EPA in 2007 by the National Academy of Science for the agency to use their regulatory tools, the EPA instead has decided to improve water quality in the Gulf through the use of a voluntary watershed effort among the states with drainages entering the Mississippi River. A Hypoxia Task Force was established in 1997 which includes several federal agencies and the states of Iowa, Illinois, Minnesota, Wisconsin, Kentucky, Tennessee, Arkansas, Ohio, Missouri, Mississippi and Louisiana. This may seem like a lot of states, but in reality, it is not even all the states which have drainage into the Mississippi River, after all the entire Mississippi River basin covers 1,245,000 square miles – 41 percent of the lower 48 states of the United States. However, the states involved in the Task Force are the biggest contributors of nutrients to the river.


The Hypoxia Task Force regularly reports on progress being made to reduce nutrient pollution. The Task Force set itself a goal of reducing the hypoxic zone in the Gulf to less than 3100 square miles by the year 2035. In order to reduce the hypoxic zone to this size, the amount of nutrients entering the Gulf of Mexico must be reduced by 45 % from the average amount of nutrients measured between1980 and1996.  An interim reduction goal of 20 % has been set for the year 2025, just seven years from now. The Task Force is relying on individual state strategies to achieve these nutrient reductions. At this point all states involved with the Hypoxia Task Force have drafted or completed strategies. Each state has set very different methodologies and plans for achieving nutrient reduction goals. Other than some targeted improvements to reduce nutrients from wastewater treatment plants, most of the actions in the state strategies are voluntary.


The Hypoxia Task Force knows where most of the nutrient pollution is coming from, after all this problem has been studied for a long time. The U.S. Geological Survey (USGS) has been able with the help of the Natural Resource Conversation Service (NRCS) to define where the greatest amount of nutrient pollution is coming from in the Mississippi River Basin. Below is a map showing the main sources of nutrient pollution to the Gulf. The map was put together by the USGS for the EPA’s 2017 Biennial Report to Congress.

Nutrient Sources to the Mississippi River from the EPA 2017 Report to Congress

As you can see from the map, the states with the greatest nutrient contributions to the Gulf are in the northern basin of the Mississippi River. So states like Minnesota, Iowa, Illinois, Wisconsin and Indiana, which are all over a thousand miles from the Gulf of Mexico, are the biggest polluters. Most of the pollution is coming from agricultural lands. Some of the causes are over fertilization of crops, uncontrolled manure at farm animal operations, and even the growing of certain types of crops, such as soybeans, which can produce excess nitrate in the soil. According to EPA, there are numerous conservation methods identified by the Department of Agriculture which can vastly reduce these sources of pollution. Studies conducted by the NRCS on conservation practices already being implemented in the upper Mississippi River Basin show reductions of nutrients can be achieved in the order of 5 to 34 % for nitrogen and 1 – 10 % for phosphorous. The NRCS studies attribute these conservation practices within the whole Mississippi River Basin to an 18 % reduction in nitrogen and a 20 % reduction of phosphorus in the surface water entering the Gulf of Mexico.


With such large nutrient pollution reductions from existing conservation practices, one wonders exactly why the hypoxic zone in the Gulf is getting larger. There are a couple of reasons. Poor nutrient controls have been in place for multiple years. A lot of the old nutrients which washed off farmland years ago are now contained within the sediment of the streams and rivers forming the Mississippi River watershed. This sediment in the stream and river channels is a continuing source of nutrient pollution into the Gulf. Every time there’s a big storm or there’s lots of precipitation then sediments containing nutrients are scoured from the river and stream channels and washed further down the river toward the Gulf. Even if you were to eliminate all the nutrients in farm runoff from now into the future, there are still these legacy nutrients over which one has to worry.


I’m afraid we always tend to blame the farmers for all our nutrient pollution problems. Farmers are probably unfairly targeted to shoulder most of the nutrient reductions when many of the causes of the long term pollution problem in the Gulf are really a result of the over engineering and channelization of the Mississippi River to provide transportation and to reduce flooding. These activities have resulted in loss of streamside vegetation, including forests and wetlands that would have helped buffer the nutrient pollution. (Here’s a link to more reading on the problems of the Mississippi River https://waterblogger.org/water-quantity/dams-and-their-impacts-on-wetlands/  .) Scientists also blamed the increased size of the dead zone on the larger and more dispersed freshwater flow resulting from the channelization and diversion of the river into the Gulf through the lower portion of the Mississippi Delta because it has spread the nutrients and the stratification in the coastal waters over a much larger area then would have otherwise occurred.


So whatever pollution reduction methods are implemented by the states through their strategies, it is unlikely to produce immediate reductions in the size of the dead zone in the Gulf even by 2035. Unless of course other options like stream and river restoration activities are also incorporated into the Hypoxia Task Force’s plans.

Chesapeake Bay Pollution

The Chesapeake Bay is a large estuary on the Atlantic coast of the United States covering about 7000 square miles and splitting both the states of Maryland and Virginia in two. Estuaries are common in coastal areas where streams or rivers enter the ocean. The Chesapeake Bay is an unusually long estuary, stretching 206 miles from the border of Pennsylvania and Maryland to its confluence with the ocean near Norfolk, Virginia. The Susquehanna River which starts in New York State and flows through Pennsylvania is the Chesapeake Bay’s main tributary. In fact the Chesapeake Bay is actually the ancient valley of the Susquehanna River which after the last glacial epoch was flooded as the glaciers melted and sea level rose. A “drowned river valley” is what geomorphologist’s call landforms like the Chesapeake Bay. Other major tributaries to the Chesapeake Bay are the Patuxent, Rappahannock, Potomac, and James Rivers.


Similar to other coastal estuaries, the Chesapeake Bay is affected by the oceans tides and is therefore a mixture of salt and fresh water, with the freshwater coming from the upland tributaries and the saline water from the ocean. The closer you get to the mouth of the Bay near Norfolk, the saltier the water gets. However, the connection between the Chesapeake Bay and the ocean is a narrow and confined one, which makes the tides in the Bay more like the Lazy River ride at the water park rather than the aggressive water slide estuaries of the San Francisco Bay or Puget Sound. Tides range from 1 to 3 feet on the Chesapeake Bay while the San Francisco Bay can range up to nearly 6 feet and the Puget Sound as much as 8 feet.


The Chesapeake Bay’s pollution problems started the day that the first European settlers stepped off the boat on Clement Island Maryland in 1634 and started clearing land, planting crops, and raising animals. The big three pollutants in the Chesapeake Bay are phosphorous, nitrogen, and sediment. Phosphorous and nitrogen are nutrients and their main sources in the Bay watershed are agricultural crops, manure from livestock operations, urban storm water, wastewater treatment plants, and atmospheric deposition from the burning of fossil fuels in power plants and motorized vehicles. Sediment of course as everyone knows comes from erosion and the chief causes of erosion in the Chesapeake Bay watershed are – agricultural practices and urban development. The fact that the Chesapeake Bay is essentially a bathtub and sediment along with nutrients settle out at the bottom, instead of flushing out to the ocean like the pollutants do in other estuaries, is one of the chief causes of the continuing eutrophication of large parts of the Bay (to learn more about nutrients and eutrophication read my post on the subject at this link  https://waterblogger.org/water-quality/nutrient-pollution/)


Eutrophication is pretty much the result of the huge algal blooms caused by excess nutrients in the Bay waters. The death and decay of algae uses up dissolved oxygen in the water. Since aquatic organisms like fish, crabs, clams, worms and so forth need oxygen to breath, they pretty much avoid these “dead zones” of oxygen less water in the Bay. The nutrients at the bottom of the Bay and the regular flushing of nutrients from soil and paved surfaces into the Bay during rain events serve as a continuing source of nutrients for the algae.


The people who live in the Chesapeake Bay area have been trying to “Save the Bay” since 1983 when the Chesapeake Bay Program was established. The states of Maryland, Pennsylvania, Virginia and the District of Columbia were the first participants. To spread the joy, other jurisdictions in the Chesapeake Bay’s enormous watershed, covering over 64,000 square mile, were signed up in 2001 to help reduce the big three pollutants. The jurisdictions include Delaware, New York, and West Virginia.


You would think with all these States getting together and all the money being spent ($73 million in 2017 alone) that the Bay would be “Saved” by now. But no, there has been very little actual will to “Save the Bay”, although everyone does a lot of talking about it.  The U.S. Environmental Protection Agency (EPA) finally got fed up with the States after 25 years of restoration efforts and pollution reduction schemes resulted in no substantial improvement in the water quality in the Chesapeake Bay. The EPA decided to work with the 7 government jurisdictions to establish a Total Maximum Daily Load (TMDL) for the Chesapeake Bay. The TMDL was issued at the end of 2010. I have talked about TMDLs in this blog before, but briefly for new readers: TMDLs are set for waters of the United States that are considered “impaired”. State governments are required under the Clean Water Act to report impaired waters in their jurisdiction and establish TMDLs that will restore the water for its designated use, such as swimming, fishing, or drinking.


The TMDL limits the amount of nitrogen, phosphorous and sediment each state can contribute to the Chesapeake Bay. Below are the actual allocation numbers designated in millions of pounds per year per state.


Jurisdiction Nitrogen Phosphorous Sediment
       
Pennsylvania 73.93 2.93 1,983.78
Maryland 39.09 2.72 1,218.10
Virginia 53.42 5.36 2,578.90
District of Columbia 2.32 0.12 11.16
New York 8.77 0.57 292.96
Delaware 2.95 0.26 57.82
West Virginia 5.45 0.59 310.88
TOTAL 185. 93 12.54 6,453.61

Source: Chesapeake Bay Total Maximum Daily Load, U.S Environmental Protection Agency, December 29, 2010


These limits reduce the total current contribution of the big three pollutants by 25% for nitrogen, 24% for phosphorous and 20% for sediment.  The total is the maximum amount of the three pollutants that the Bay can receive and still meet Water Quality Standards for dissolved oxygen, water clarity, submerged vegetation, and chlorophyll a (chlorophyll a is a measurement means of determining how much algae is in the water).


In order to meet these goals each State had to submit to EPA a Watershed Implementation Plan showing what projects would be undertaken to meet their limits. As part of each state plan there are short and long term milestones that must be met. The goal is to meet Water Quality Standards in the Bay by 2025. Well that’s not exactly correct. In reality and according to the scientist’s models, the Chesapeake Bay will only theoretically meet Water Quality Standards by 2025. The scientists studying and working to “Save the Bay” often refer to a “lag time” for achieving Water Quality Standards which is a result of the legacy pollutants built up in the Bay and all of its tributaries, and which will continue to contribute to poor water quality even after the limits for the big 3 pollutants are met in 2025.


By setting the TMDL, the EPA essentially drives the Chesapeake Bay Program now. There are short term milestones to be achieved every 2 years in order to show incremental progress in restoring the Bay. These short-term milestones are primarily agricultural management improvements to reduce pollution, because it is the easiest way of achieving progress. There is a good bit of money available through the Department of Agriculture to assist farmers in conservation efforts. These agricultural management strategies target alternative and cover crops, tillage practices, manure waste management, water control structures, pasture management, etc. Other easy short term targets are restoration of wetlands, planting of stream side (riparian) vegetation like trees, and reductions in the atmospheric deposition of nitrogen since nitrogen is regulated under the Clean Air Act causing the amount of nitrogen in the atmosphere from fossil fuel combustion to slowly decrease over the years.


To see if the TMDL and the long range milestones in the Watershed Implementation Plans would restore the Bay by 2025 as envisioned, the EPA decided to ask the National Research Council (NRC) to assess whether their new plan to “Save the Bay” would achieve its goals and objectives. It was the first real outside assessment of the Bay Program other than a nasty General Accounting Office assessment in 2005. The NRC published a great big report on the subject in 2011, entitled “Achieving Nutrient and Sediment Reduction Goals in the Chesapeake Bay.”


It is an amazing report, full of interesting statistics. For example did you know that 17 million people live in the Chesapeake Bay watershed? That’s a lot of people. But those people are widely dispersed, except for urban centers like Washington, D.C. and Baltimore. Only 7 % of the land in the watershed is urban and amazingly only 22 % is agricultural land. The rest is wooded and open space. But the report brings up the worrisome nature of the continued urban growth within the watershed.


According to the NRC, there has been significant success in decreasing nutrients from municipal waste water treatment plants in urban centers. Permit requirements were put in place back in 2005 which resulted in massive upgrades to nutrient removal systems in the wastewater treatment works of cities and towns within the Chesapeake Bay watershed. The NRC cites statistics that as of 2009, 78% of wastewater treatment plants had achieved 78 % of the reduction goals for nitrogen and 99 % of the phosphorous goals set by EPA to improve water quality in the Bay. But as the NRC points out, as population in the watershed grows, there will simply be more wastewater to treat, and more effluent released into the rivers to flow down to the Bay.


The NRC report outlines major concerns with storm water reduction goals for urban areas. Storm water is the water that runs off of streets and yards into either a storm water collection system or directly into water ways. The report says the limits set for reduction of pollutants from storm water will be the most difficult to achieve because of the high costs and the low removal rates of technologies used to decrease the big 3 pollutants. The NRC questions the ability to achieve the storm water pollution reduction goals due to the rapid rate of population growth and development in the Chesapeake Bay’s watershed. What sort of technologies is the NRC referring to for storm water management? They are talking about rain gardens, use of pervious materials instead of asphalt and concrete, use of narrower streets, and sunken medians. These technologies can all be achieved through regulation for new development, but it will be hard to get existing development to implement them because of the expense. The NRC says they are costly and inefficient because they rely on their widespread use across a landscape to remove pollution from many small sources.


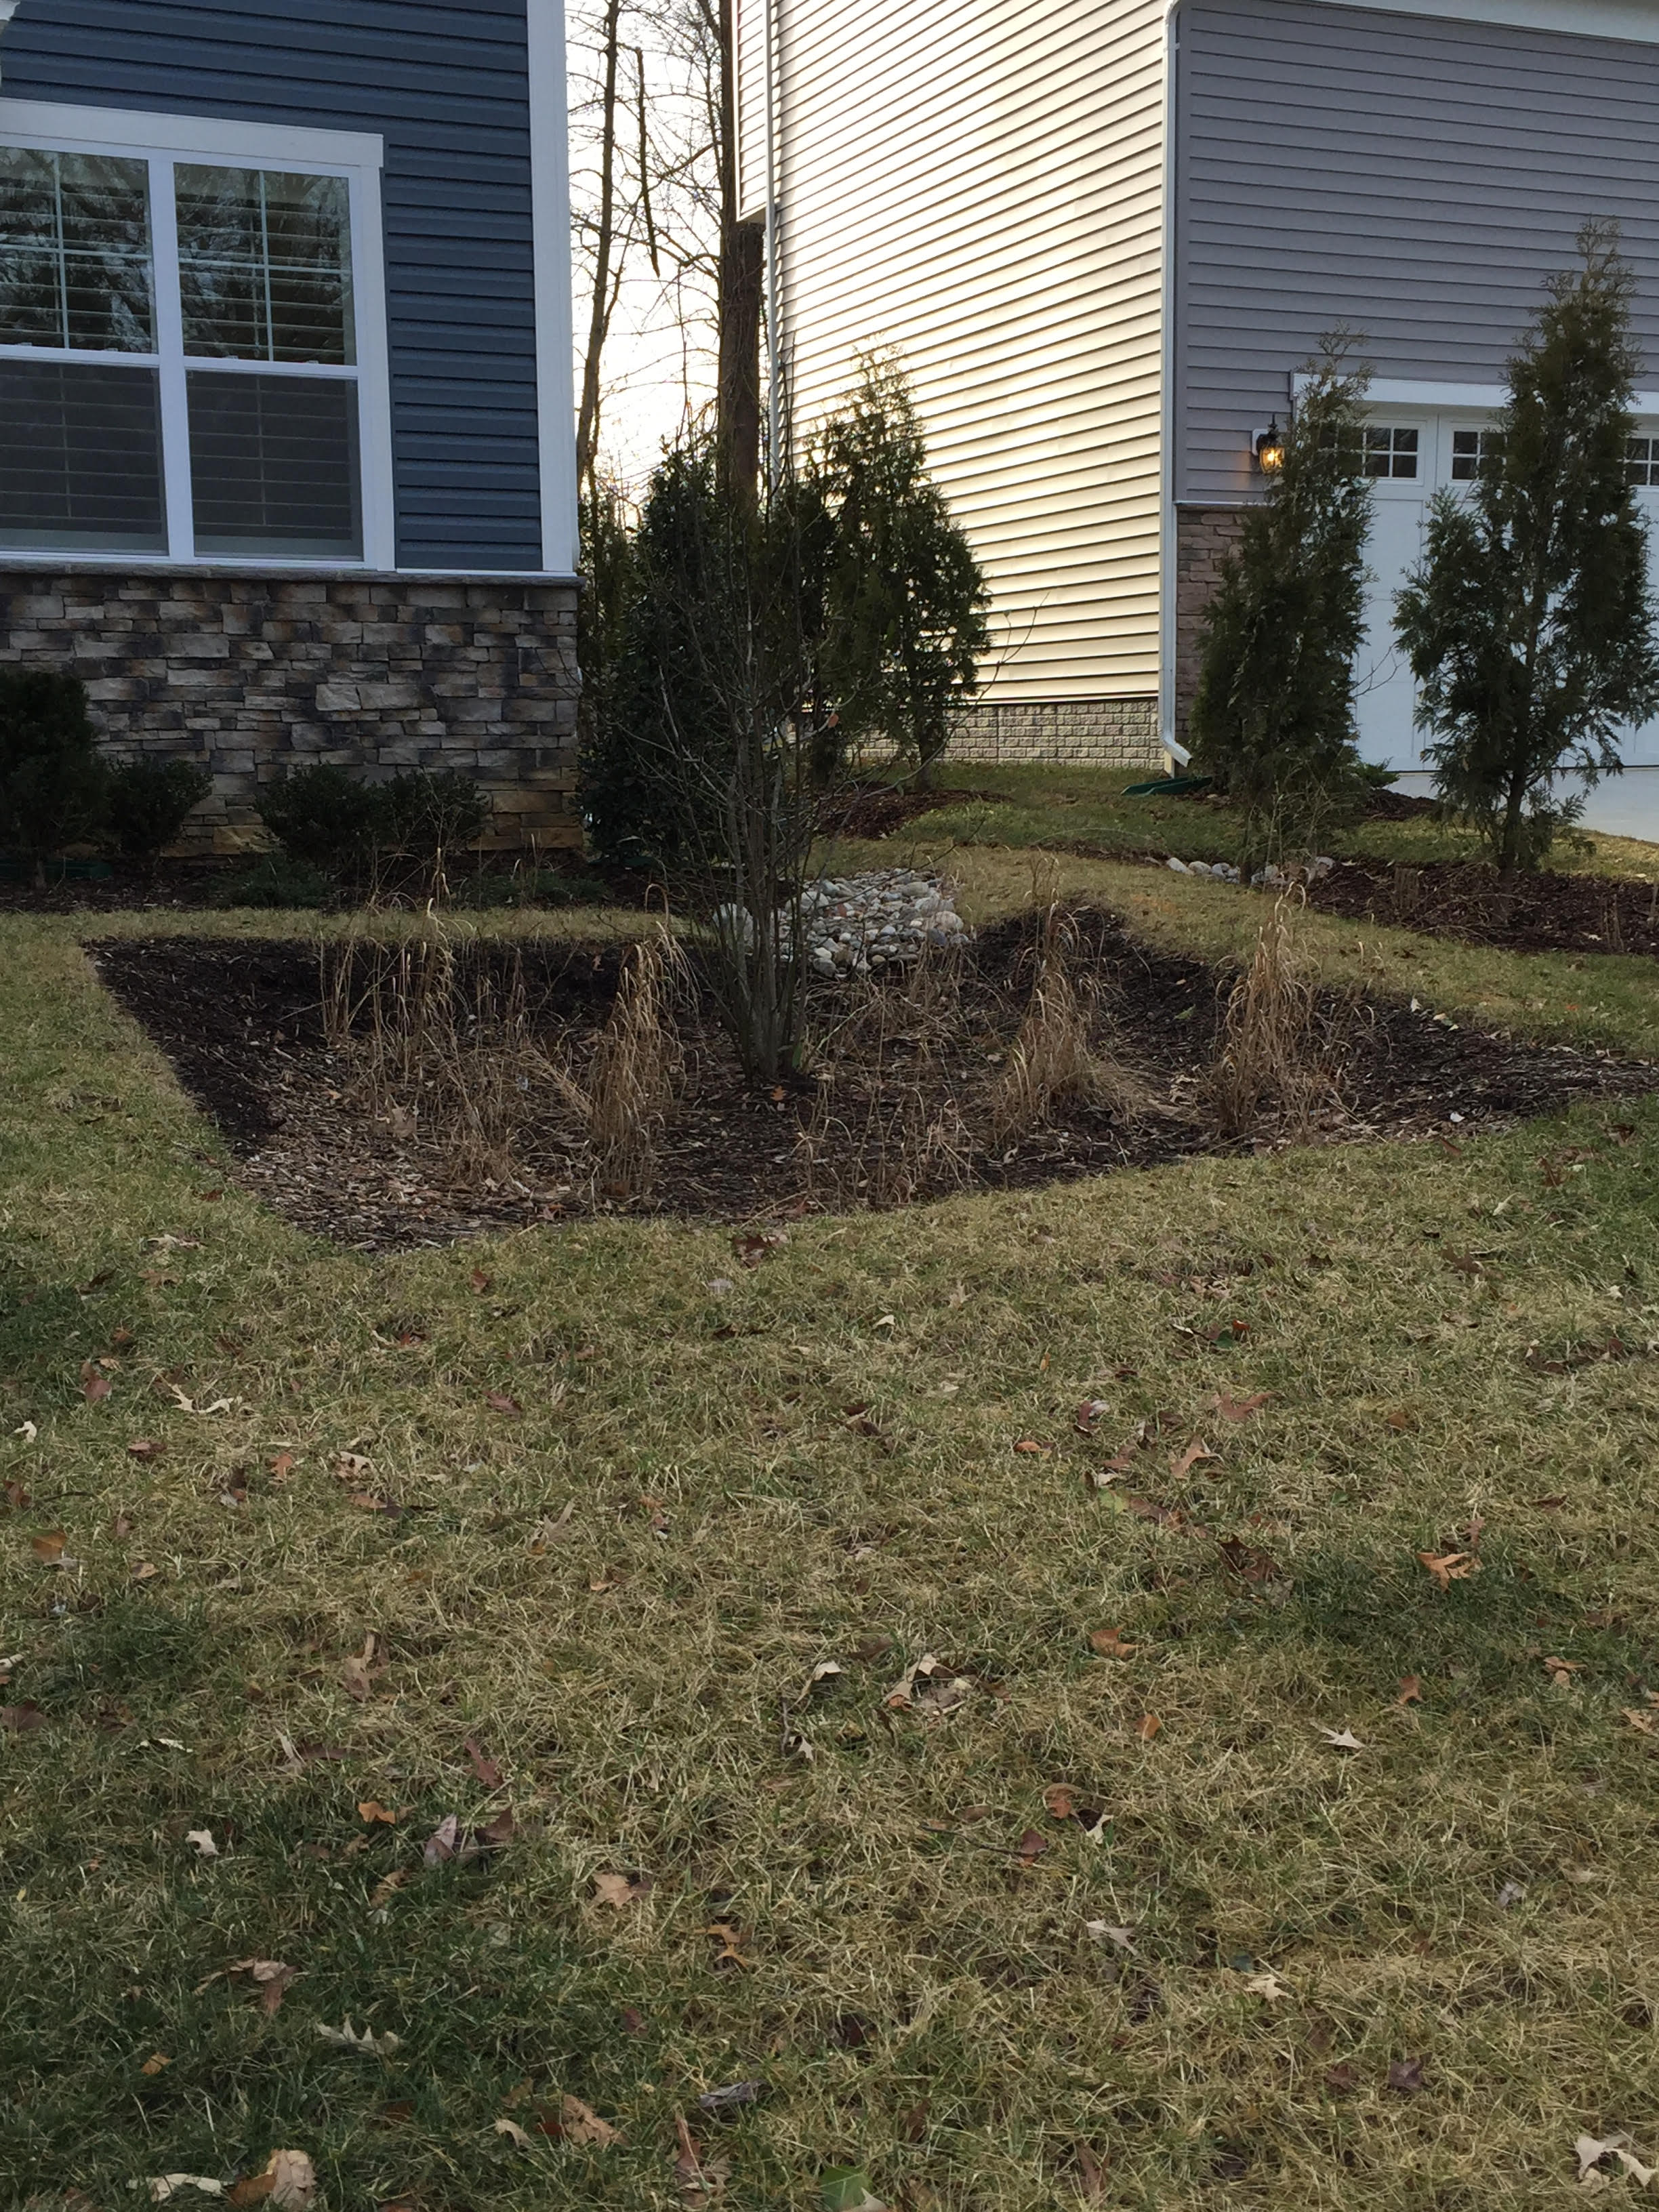
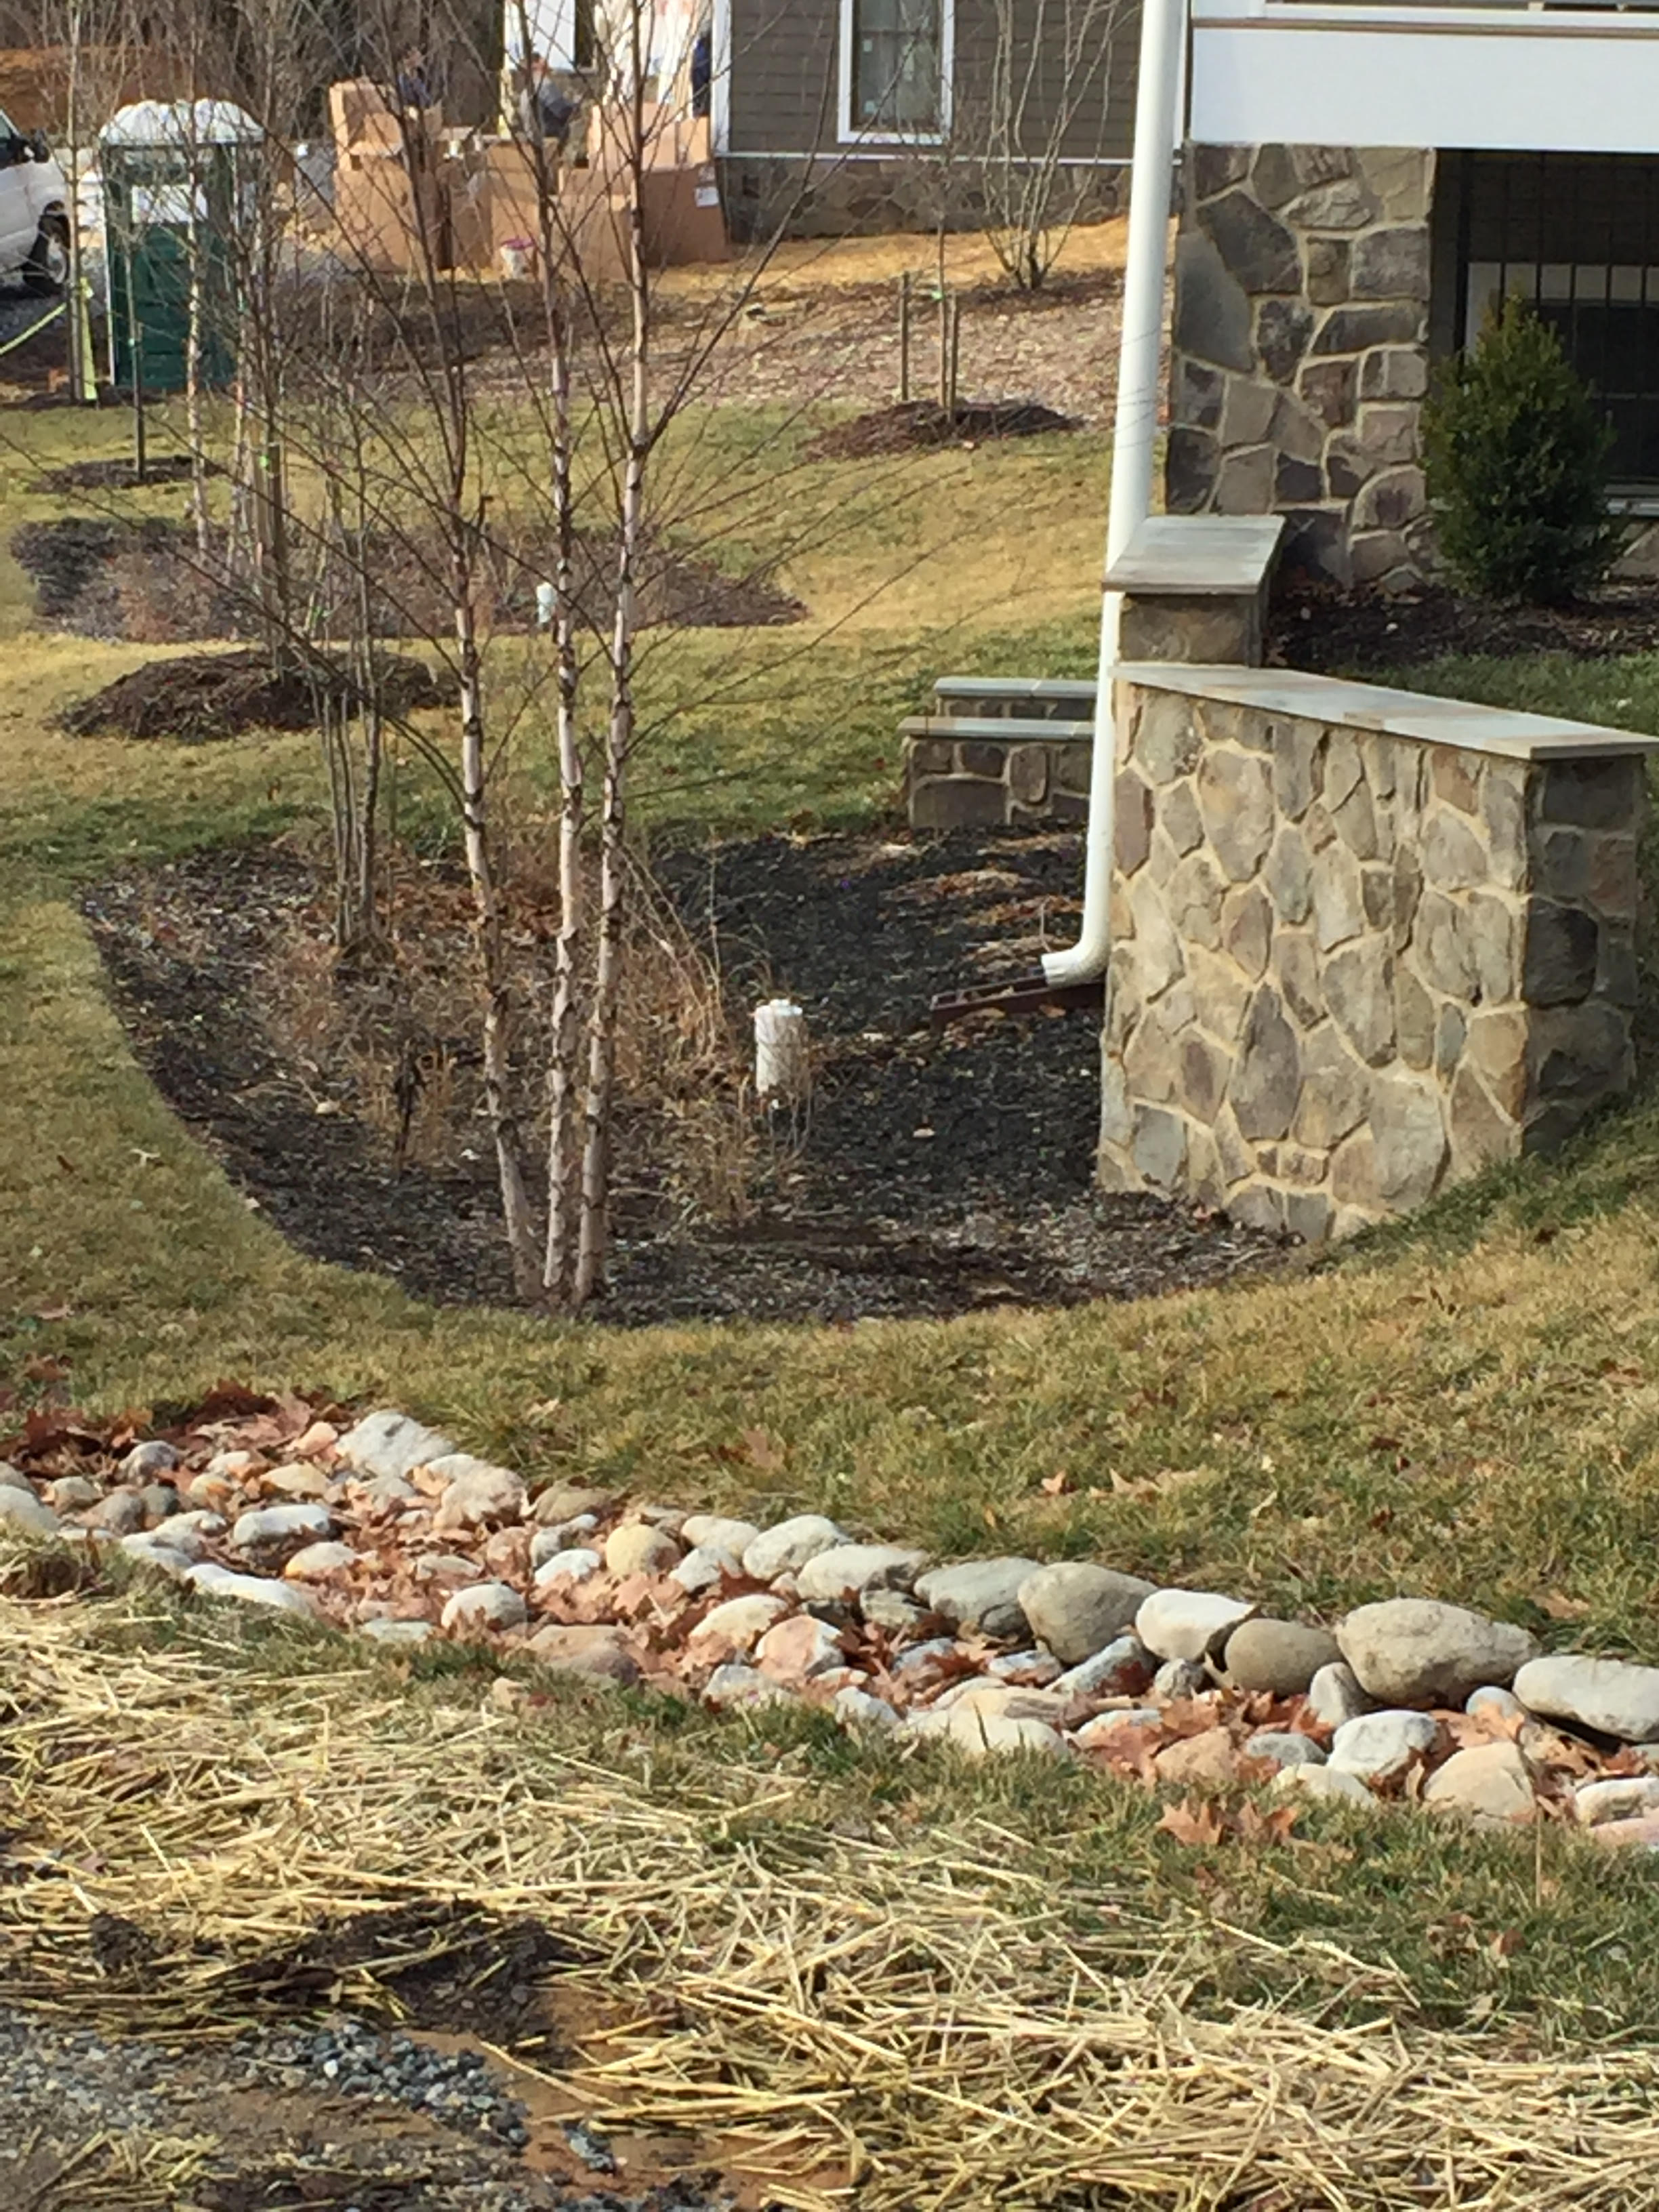
What do they look like? Here’s pictures of some rain gardens installed in new development. This is on a large piece of property where there was only one house, but zoning authorities allowed it to be torn down and 5 houses built in its place as long as they installed rain gardens.


I know you are laughing. This is supposed to “Save the Bay”? And how long do you think these are going to stay in place before the homeowners see them as a safety issue for children playing in the yard? That is the other problem with these types of features – maintaining them.


The other source of pollution that the NRC says will be difficult to reduce is the nutrient pollution from septic tanks. The NRC report states that between 1990 and 2000, the watershed population increased by 8 % but the land converted to development more than doubled. Much of this development is what you often hear referred to as “suburban sprawl” and many of the areas where it has occurred do not have access to urban wastewater treatment systems. NRC says 25 % of the housing in the Chesapeake Bay watershed is served by septic tanks which produce 33 million pounds of nitrogen every year. Most of that nitrogen ends up in the groundwater and is slowly transported through groundwater flow into surface water bodies and down to the Bay. The amount of time (sometimes decades) groundwater takes to reach the Bay is another lag time issue that scientists have pointed out in discussions about meeting Water Quality Standards by 2025. These days, very efficient nitrogen removal septic systems are available, but even if everyone installed one at their house, there is still all the legacy nitrogen in the groundwater from the old systems which is slowly flowing like a ticking time bomb toward the tributaries of the Bay. But of course not everyone is going to install super efficient septic systems because they are extremely costly. Many States plan on transitioning all these homes to centralized wastewater systems – another expensive endeavor.


The NRC says the population within the Chesapeake Bay watershed is estimated to reach 19 million people by 2030. Based on the current land development rate, the amount of developed land could increase by 60 %. Impervious surfaces cover 18 % of all lands in the watershed now and, according to the NRC, stream water quality is impaired when impervious surfaces in a watershed cover 5 to 6 % of the land.


So it has been seven years since the TMDL for the Bay was established and there are only eight more years in front of us until the Bay must meet Water Quality Standards. How do you think the restoration effort is going? Well it is easy to find out. The EPA produces a report every year titled: The Bay Barometer. The 2017 report is not available yet, so I took a look at the 2016 Bay Barometer. There’s some good news in the report. The number of acres of submerged grasses has greatly increased through restoration efforts. These underwater grasses are critical in providing food and shelter to aquatic animals. They also produce dissolved oxygen and absorb nutrient pollution. The Bay Program’s goal is to restore 185,000 acres by 2025 and already half of that has been achieved. Eighty two percent of a targeted 2500 miles of stream has been opened to migrating fish by removing dams and culverts.  Blue crabs are back in the Bay in great numbers as a result of crab harvesting restrictions. The goal was 215 million adult females by 2025 and already 90% of that number has been reached. Unfortunately that is about it on the success level. Planting trees along streams is way down; only 9 % of the wetlands targeted for restoration have been achieved; and only 50% of the land targeted for conservation has been protected.


There have been some improvements in water quality. Thirty seven percent of the Chesapeake Bay and its tidal tributaries met Water Quality Standards for dissolved oxygen, chlorophyll a, and clarity. That’s a 10 % increase over the previous reporting period, but it is far below the 100 % expected by 2025.


As for the big three pollutants, there was a 25 % reduction in nitrogen, a 44 % reduction in phosphorous, and a 59 % reduction in sediment from the previous year. Unfortunately again and according to The Bay Barometer, the reductions are due to the volume of river flow, which leads to the sad sorry fact that nitrogen, phosphorous and sediment levels are the highest during years of high rain when the rivers and streams are pouring water into the Bay and that the pollutants levels are lowest during dry years when the volumes are far less. The highest amount of nitrogen, phosphorous and sediment recorded in the last 10 years was in 2011 after Tropical Storm Lee.


The Chesapeake Bay Program is a good endeavor, even if its successes so far have not been great. At least the whole Bay is not completely lacking in dissolved oxygen. If things had continued as they were, the Bay would probably be in much worse shape than it is now. The best analogy for the Chesapeake Bay’s pollution problems might be the nursery rhyme of Humpty Dumpty who sat on a wall from where he had a great fall; then all the king’s horses and all the king’s men never could put Humpty back together again. The Humpty Dumpty Bay will continue as long as overdevelopment occurs in the Bay’s watershed. Development has broken the natural processes that once kept the Bay a healthy ecosystem. Government officials, scientists and non-governmental institutions are working hard to “Save the Bay”, but without restrictions on development, the task is like another analogy I can think of: Sisyphus pushing the ball up the hill in Hades.

Nutrient Pollution

My recent post on the Bloede Dam removal in Maryland prompted me to dwell a little bit on the nutrient pollution that continues to plague our water resources. Nutrients are the chief polluter of our river systems, lakes and coastal waters. It is such an old problem, but it just never gets resolved. When scientists talk about nutrient pollution, they are referring to phosphorous and nitrogen entering our waterways through surface run-off and groundwater discharge (referred to as “non-point sources”) and through direct discharges from wastewater treatment plants and other end of pipe sources (commonly called “point sources.”) Scientists are alarmed about the ever increasing amount of nutrients in our waters. So much so that a few years ago, the U.S. Environmental Protection Agency (EPA) commissioned a Nutrient Innovation Task Group composed of water managers and scientists from state governments, federal agencies and universities to define the problem. The Task Groups Report was issued in late 2009 and was actually entitled “An Urgent Call to Action.” It is a source of amazing statistics.


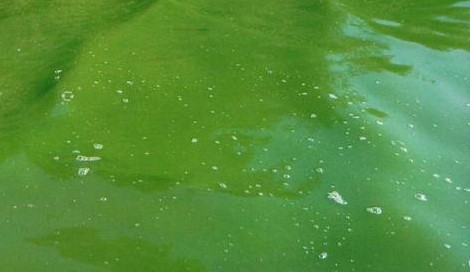
Just a refresher in case you don’t remember, but the problem with nutrients in our waterways is the resulting algal blooms. Scientists don’t call phosphorus and nitrogen nutrients for no reason. Both nitrogen and phosphorous are needed by living organisms for cell growth. This is why farmers spread it on their crops as fertilizer. It is why homeowners use it on their lawns. So when you have a lot of nutrients going into the water, it is like fertilizing the algae. Add sunshine and you get a bumper crop. Not really what anyone wants, because when the algae inevitably die off, the decay of their little dead algae corpses uses up the dissolved oxygen in the water through a process called eutrophication. Eutrophication produces “dead zones” or what scientists refer to as hypoxic zones. The quantity of floating algae (called phytoplankton) can increase so much that their mass actually blocks sunshine into deeper waters, depriving beneficial grasses and other vegetation that are to be found in the bottom of water bodies of the light they need for growth.


The Nutrient Innovation Task Group’s report states nutrient pollution along with the consequent overgrowth of algae and other nuisance aquatic plants as well as decreases in dissolved oxygen impairs 31% of assessed rivers and streams in the U.S., 30% of our lakes, and 50% of our bays and estuaries. The word “impairs” simply means that the function of the water resource is diminished. An example of an impaired water body would be an estuary which once supported a vital fishing industry but now has large “dead zones” where there is so little oxygen that fish can’t breathe and they have either died or vacated the area.


All of the excess nutrients entering our water bodies are from just a few sources, but they are large sources. Much of it comes from agricultural production. If there are no runoff controls on agricultural fields, excess fertilizer applied to crops can be washed into local streams. Manure from chicken and cows are also a big source of nitrogen and phosphorous to local waterways if not managed and controlled adequately. Urban storm water is another big source of nutrients as a result of all that lawn fertilizer we apply. Then there’s all the nitrogen and phosphorous coming out of wastewater treatment plants and septic systems. Humans in the U.S. produce about 18 million pounds of poop annually which is treated somewhat inadequately at our wastewater treatment plants. In 2009 when “An Urgent Call to Action” was published only 4% of the 16,500 wastewater treatment plants in the U.S. had limits for nitrogen in their permits and only 10% had limits for phosphorous. Then there are the 20% of homes in the U.S. which are on septic systems and are contributing nutrients to our surface waters via groundwater flow.


Oh wait a minute; I nearly forgot to mention another major source of nitrogen. It is from atmospheric deposition. When fossil fuels are burned in cars and power plants, it results in nitrogen oxides being emitted into the air. As they say, what goes up eventually comes down. And it comes down directly into our water resources or it is washed off our urban centers during storms and eventually makes its way into our waterways as well.


There are two well known, well studied water bodies where nutrients have caused major problems – the Gulf of Mexico and the Chesapeake Bay. The 2009 report cites that hypoxic zones cover 7900 square miles of the Gulf of Mexico and over 40% of the Chesapeake Bay. The report had a very interesting chart which I’m going to share here. It is the estimated sources of phosphorous and nitrogen going into these two water bodies.


Source: An Urgent Call to Action. Report of the State-EPA Nutrient Innovations Task Group. August 2009.

As you can see the source of most of the nutrients going into the Gulf of Mexico are from agricultural production, while nutrients going into the Chesapeake Bay are about equally split between agricultural production and urban sources.

Nutrient pollution is not a stagnant problem, because the population continues to grow. In the report by the EPA Nutrient Innovations Task Group, the chief cause cited for the escalation of nutrient pollution in water is the increase in the U.S. population. In addition, the report predicts the U.S. population will grow by 135 more million people by 2050, exacerbating the amount of nutrients flowing into our waters. The report written almost eight years ago now, states that current controls to reduce nutrient pollution of our water resources are totally inadequate. In response, the U.S. EPA and state environmental regulators developed a “Framework for State Nutrient Reductions” in 2011. The framework reflects a partnership effort to reduce nitrogen and phosphorous in U.S. waterways by prioritizing watersheds for reduction efforts and then setting actual goals such as strengthening permits for waste water treatment plants and other point sources, establishing strong programs to promote land stewardship practices for agricultural lands, and improving storm water management in urban areas.

As part of this effort states are being asked to establish numeric goals in priority watersheds for reduction of nutrients. When water scientists talk about the amount of nutrients entering a water body, they call it a load. So these efforts are aimed at reducing nutrient loads into water resources. EPA guidance in the past allowed for narrative or numerical criteria for establishing pollution concentrations below which a water body would be able to achieve its full designated use – such as commercial fishing or swimming. Narrative criteria have been mostly used by state water managers and have been rather useless in achieving improvements. Narrative criteria simply state what condition you want to achieve. Numerical criteria establish what nutrient loads must be imposed for both point sources and non-point sources entering a water body. As you can imagine numerical criteria are much harder to establish than a simple statement of what you’d like to achieve.


With the proposed framework and a call by EPA to provide numeric criteria as opposed to narrative criteria for attaining the water quality goals for a water body, I would expect to see some improvements over the last six years. After all as the old adage says, what gets measured gets done. So as a follow-up to this blog post, I will be examining over the next few months whether improvements have been achieved in the two largest hypoxic water systems in the U.S. – the Chesapeake Bay and the Gulf of Mexico.