Tag Archives: Floodplain wetlands

Riverine wetlands adjacent and connected to river systems

Georgia Coastal Pollution

The world lies east: how ample, the marsh and the sea and the sky!

A league and a league of marsh-grass, waist-high, broad in the blade,

Green, and all of a height, and unflecked with a light or a shade,

Stretch leisurely off, in a pleasant plain,

To the terminal blue of the main.

Oh, what is abroad in the marsh and the terminal sea?

Somehow my soul seems suddenly free

From the weighing of fate and the sad discussion of sin,

By the length and the breadth and the sweep of the marshes of Glynn.

– Sidney Lanier
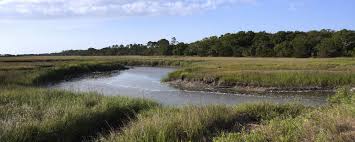
Marshland in Georgia


Georgia has the largest extant marshland along the entire Atlantic coast. Except for the intrusion of Interstate 95 and the growth of the cities of Savannah and Brunswick, the landscape has changed little since Sidney Lanier wrote his poem about the Marshes of Glynn in Georgia during the 1800’s. The reason for the wetland preservation is the forward thinking people of the state of Georgia who back in 1970 supported and passed a law protecting the coastal marshes of Georgia (Georgia Coastal Marshlands Protection Act.) Georgia has around 370,000 acres of estuarine tidal marsh bordering its 100 mile coastline. The state has also protected most of the barrier islands along the coast and they are primarily state and federal parkland. With such little development one might expect nearly pristine water quality off the coast of Georgia. One would be wrong.

Five major rivers flow through the coastal region of Georgia and empty into the Atlantic Ocean – the Savannah, the Ogeechee, the Altamaha, the Satilla, and the St. Mary’s Rivers.  The Satilla and St. Mary’s River are blackwater rivers. Blackwater rivers are named for the color of their water which is a dark tea brown to black. The color results from the decay of the abundant vegetation in the marshes through which the rivers flow. The water in blackwater rivers is usually more acidic than rivers with clear water and it may also have lower dissolved oxygen because of the vegetative decay. The watersheds of all five rivers are large and encompass not only the salt and freshwater marshes along the coast but the upstream woodlands, agricultural lands, and small cities and towns which dot the region. Forests and wetlands are the primary land cover in these watersheds. Farms only make up 8 percent of the land use. The widely dispersed population centers cover 7 percent of the land.

In spite of the near perfect ecological conditions along Georgia’s coast, each of the rivers has impaired water quality. Impaired water quality means that the water in a certain stretch of the river does not meet the pollution standards for the water’s designated use, like fishing or swimming. The Georgia Environmental Protection Division issued a Surface Water Quality Resource Assessment in 2017 which identified 413 miles of impaired waters in the 5 coastal watersheds and impairment of two inlets where the rivers meet the ocean. The major cause of impairment is low dissolved oxygen, which is problematic for aquatic organisms like fish since they (like us) need oxygen to survive. The second cause of impairment is fecal coliform. Fecal coliform is a bacteria produced in the intestines of humans, other mammals, and birds and is discharged with their poo.

If you were a water scientist, you would immediately suspect – based on the fecal coliform levels in the surface water of the rivers – there might be a gigantic wastewater treatment problem in the towns and cities within the watershed. But no, the Coastal Georgia Regional Water Plan issued in June 2017 identified Bryan County wastewater treatment plants as the only ones in the entire area needing upgrades to meet water quality. The main contributors to water pollution, according to both The Surface Water Quality Resource Assessment and the Coastal Georgia Regional Water Plan, are non point sources like urban development in the small towns and cities within the watersheds, agriculture which consists primarily of livestock operations in the upland areas, and silviculture (a fancy name for tree farm operations). Widespread use of septic systems in this rural environment is also probably a major contributor to surface water degradation.

Blame for some of the dissolved oxygen problems also can be laid on the nutrients – nitrogen and phosphorous, but the lack of widespread dead zones such as the ones in the Gulf of Mexico caused by fertilizer runoff into the Mississippi River and the ones in the Chesapeake Bay caused by fertilizer run-off and overdevelopment in the watershed don’t exist off the coast of Georgia. Nutrients cause algae blooms. The algae die and their decay depletes the water of oxygen. The lack of widespread nutrient related dead zones off the coast of Georgia can be attributed to the lack of development and limited agricultural operations, but also to the existence of abundant marshlands. All wetlands remove nutrients from water. This has been documented in a number of scientific studies over the last thirty years. The soils in wetlands are called hydric soils because they are saturated. These types of soils are full of organic matter from all the decaying wetland vegetation. Denitrifying microbes love these soils and provide a substantial removal system which locks up the nitrogen and keeps it from flowing out of the wetland. The marsh plants also like the excess nutrients because it helps them to grow, so they suck up as much of it as they can get. Waters leaving a marsh are substantially cleaner than those which entered, so much so, that environmental scientists often construct artificial wetlands just to treat nutrients. Georgia’s preservation of their coastal wetlands has helped save them from the nightmare conditions which other aquatic environments are undergoing.

The Coastal Georgia Regional Water Plan is part of another forward thinking effort by the Georgia state government to engage in state wide water planning efforts to sustainably manage water resources throughout the state. State wide water planning began in 2009 and the first coastal plan was issued in 2011. The 2017 plan is an update. The goal of water planning on the Georgia Coast is to meet water demands while protecting ecosystems dependent on clean water such as Georgia’s significant offshore commercial and recreational fisheries.

The Coastal Regional Water Plan recognizes the sources of contamination and the impairments identified in the 2017 Surface Water Assessment and has established specific actions to be taken to reduce pollution including replacing and upgrading the wastewater treatment plants in Bryan County or moving their discharge locations. Also identified in the plan is a monitoring program to determine the sources of the persistent fecal coliform contamination, establishment of best management practices for stormwater runoff such as retention ponds and erosion controls, providing silviculture operations with incentives for restoring wetlands, and supporting implementation of agricultural runoff controls such as manure management, conservation tillage, and planting of cover crops.

Most actions under the plan are anticipated to be implemented by the year 2025. Little future development is anticipated along the coast because of the protections the state of Georgia has provided for their marshlands. These protections will limit the surface water degradation which is found in other states like Louisiana ( https://waterblogger.org/water-quality/gulf-of-mexico-pollution/) and Maryland (https://waterblogger.org/water-quality/chesapeake-bay-pollution/ ) where wetlands have been destroyed and as a consequence there has been serious water degradation from nutrient pollution.

This is the fourth blog post in a series concerning nutrient pollution.

Selenium Contamination

So many reports assessing environmental conditions erroneously list selenium under the category of heavy metals or toxic metals. Selenium is not a metal at all. On the periodic chart, it is actually located between sulfur and tellurium and is part of what is called the oxygen family. Chemically, selenium acts somewhat similar to sulfur in that it combines with a lot of metals. It is often found in metal sulfide ore deposits (for example at copper and zinc mines), which may be why a lot of environmental scientists and engineers group it in with heavy metals when they are assessing water or soil for environmental contaminants. Selenium has long been known to have environmental impacts on egg laying animals such as fish and birds, but in humans selenium toxicity is rarely seen.


I checked with the bible of references for toxicity: The Agency for Toxic Substance and Disease Registry’s (ATSDR) Toxicological Profile for Selenium. The reference was updated in 2003. The reference gives only a few cases of selenium toxicity, mostly from industrial chemical exposure. But there are two interesting cases in China of selenium toxicity due to long term ingestion of high levels of selenium in food. Crops in these areas of China were planted in soils with very high natural selenium content and as a result selenium became incorporated into the plants biological structure during growth. Common health effects seen by doctors examining the people who lived in these areas were brittle hair and deformed nails. Tooth loss and the loss of feeling and control of arm and legs in some people were also noted. There’s actually a name for the health effects of too much selenium in your diet. It is called selenosis. It’s found not just in humans but in other mammals as well.


The Toxicological Profile also noted health effects due to low selenium in people’s diets. In fact, there is a Recommended Daily Allowance (RDA) for selenium. If you take a one a day vitamin like I do, you can see selenium listed right on the label.

IMG_1476

The RDA is 0.055 milligrams per day. Selenium is a vital trace element for humans and animals, but can be harmful at levels greater than recommended. The ATSDR noted that ingesting 10 to 20 times the normal amount of selenium can result in selenosis. So there’s actually a fair amount of difference between what’s needed and what’s toxic. The average American is getting somewhere between 0.071 and 0.152 milligrams per day depending on where they live and what they are eating. You’d have to be getting 0.55 milligrams a day of selenium over an extended period to have any toxic effects. Unfortunately for birds the difference between the level of selenium essential for daily nutrition and a toxic amount is very small. Bird toxicity is often the main concern when you see high levels of selenium in water and fish. The well known results of selenium poisoning in birds are eggs that don’t hatch and deformed chicks. Both fish and birds pass the selenium they ingest to their eggs. Humans excrete most of the selenium they eat in their food. Excrete is the polite way of saying we pass it out through urine or feces. The ATSDR noted no human reproductive issues from selenium. In fact the RDA for selenium for pregnant and nursing women is actually a tiny bit higher than for other adults.


Selenium is everywhere. It can be found in rocks and soils all over the world at very low levels. However there are certain areas of the earth where the rocks and soils are enriched in selenium. A lot of these rocks formed back during the last days of the dinosaurs in the time period geologists call the Cretaceous. I suppose I shouldn’t say the last days of the dinosaurs, because those last days lasted for eighty million years – but hey dinosaurs were around for quite awhile before then. The Cretaceous was also when plate tectonics sort of arranged the world’s landmass in the shape, if not the position, of the familiar continents we know today. In the Late Cretaceous there were a lot of very shallow inland seas. Much of the midwestern and western parts of the United States were covered with these shallow water bodies and over the millennia they filled with rich marine organic rock and evaporite deposits. Evaporite deposits are rocks like gypsum, salt and phosphate. Organic rich rocks include oil shale and coal. Rocks formed in these shallow marine basins contain higher levels of selenium compared to other rocks. In the Cretaceous these shallow marine basins existed not only in the United States but also around the world. There are younger rocks formed under the same conditions that also have the same high selenium content; notably the phosphate rocks in southeast Idaho.


These rocks are the source of a lot of trouble for the fish and bird populations of the world. The problem was first noticed way back in the 1970’s at a place called Belews Lake in North Carolina. Belews is not a natural lake. It is a man made reservoir that is essentially a cooling basin for a power plant – a coal fired power plant. One of the sources of water to the reservoir was a fly ash settling pond. When you burn coal you get fly ash. It’s what’s left over after the organic content is burned to create electric energy. It looks a lot like the ash you get in the bottom of your grill after barbequing with charcoal, except charcoal is made from wood. Coal is essentially a rock with a lot of organic matter. You have all sorts of elements in coal that are rock like – silica, aluminum, iron, and calcium. You also have arsenic, cadmium, chromium, molybdenum, mercury and the subject of this blog post – selenium. Some of these elements go up the stack of the power plant as air pollutants but the majority is left behind in the fly ash.


There are lots of accounts of what happened at Belews Lake, but in my opinion, William Frankenberger and Richard Engberg did the best review of the incident in the 1998 publication: Environmental Chemistry of Selenium published by Marcel Dekker, Incorporated. According to their report, the water entering the reservoir from the fly ash settling pond contained 150 to 200 micrograms per liter (parts per billion) of selenium. Doesn’t sound like much does it? In fact, in Belews Lake itself the selenium concentrations in the water were on average only 10 micrograms per liter. But when wildlife scientists started looking at why fish populations were disappearing in the lake, they found up to 70 percent of the fish in the lake had reproductive abnormalities and 16 fish species once found in the lake were totally gone. By 1978 only four species of fish were left in the lake and when their tissues were analyzed for selenium, they were found to exceed 100 milligrams per kilogram (parts per million).  Instead of excreting the selenium, the fish were storing the selenium in their bodies and passing it on to their eggs. Were the fish drinking the water? Of course not, the selenium in the water was being taken up by algae and other microorganisms and entering the food chain, which for fish include a lot of insects, worms, and the like who thrive on algae and microorganisms. In upstream reaches of Belews Lake unaffected by the water from the fly ash pond, normal fish communities were found. There the water contained less than 5 micrograms per liter of selenium. Noting the difference, scientists could pretty much conclude selenium is not good for fish. This was such a notable account of poisoning of fish from low selenium concentrations in water that in 1987 the Environmental Protection Agency changed their selenium freshwater criteria for the protection of aquatic from 35 micrograms per liter to 5 micrograms per liter.


The other landmark environmental account of selenium poisoning is that of the Kesterson Reservoir in the San Joaquin Valley of California. People often speak with reverence about the studies conducted there and scientists talk about the Kesterson Syndrome. Messieurs Frankenberger and Engberg also describe the Kesterson studies in the Environmental Chemistry of Selenium. Remember those Cretaceous marine rocks I described earlier? There are a lot of those exposed at the surface in the San Joaquin Valley in California. I think all Americans know the San Joaquin as a fertile agricultural valley in California, but like all agriculture in the dry western states, they water the heck out of it. There is a lot of agricultural drainage as a result and back in the 1970’s the state of California got the idea to build large shallow impoundments to serve as evaporation basins for the drainage, which could also be managed as a wetland in order to benefit wildlife. Sounds like a win/win right? In fact it looked like it was going to work. The ponds at first received all sorts of good quality agricultural water and a large size marsh with thriving wetland plant communities was established. Wildlife populations began to flourish. Then the impoundments started receiving the saline subsurface drainage from the agricultural irrigation. By 1981 all of the flow into the impoundments was this saline drainage and by 1982 scientists started seeing deterioration of the wildlife in the marsh.


When scientists measured the amount of selenium discharging into the marsh from the irrigation drainage, the water averaged 300 micrograms per liter. The many different fish species that once populated the marsh were gone. The only species left were the mosquito fish which is known to tolerate pollution pretty well, but even they were suffering from reproductive abnormalities and unhatched eggs. Mosquito fish had as much as 120 milligrams per kilogram selenium in their body tissue. Eggs of water birds in the marsh were analyzed by scientists and ranged from 4 to 70 milligrams per kilogram selenium, depending on what type of bird egg it was. I think Kesterson is where scientists first recognized that even among birds there were variations in tolerance for selenium. Scientists checked nests for eggs that failed to hatch. In one count of 578 nests, 39 percent of eggs in the nests had one or more eggs that did not hatch. Up to 15 percent of the egg embryos examined had deformities. Now I was going to include a photo from a U.S. Geological Survey report on bird deformities due to selenium, but I know some of my readers are a little sensitive. So I’m just going to provide a link. If you get queasy looking at road kill, do not click on this link:  http://www.nwhc.usgs.gov/publications/field_manual/chapter_44.pdf .

Fortunately drainage to the Kesterson Reservoir was stopped in 1986.


There are dozens more examples of where low levels of selenium have resulted in environmental damage. There has been a lot of research on selenium since the incidence at Belews Lake and in July of 2015, the Environmental Protection Agency issued a draft proposal for further updating the selenium water quality criterion for protection of aquatic life.

Dams and their Impacts on Wetlands

In my post on the Clean Water Rule and floodplain wetlands, I mentioned floodplain wetlands had been reduced so much after hurricane Katrina that scientists were concerned about the increased risk of flooding from future storms. I didn’t have time while I was writing the post to do a fact check on how much of the wetlands in Louisiana had been impacted, but I decided to follow-up just for my own information. I sat through a presentation by U.S. Geological Survey scientists twice on this subject, so I went looking to see if I could find the information on their website. I was amazed to find the very PowerPoint presentation I’d seen some eight years ago now.  It was produced by the Geological Survey’s Wetlands Research Center and the Louisiana Coastal Area Land Change Study Group. It provides a close look at land loss after the hurricane in comparison to land loss before the hurricane. They used satellite images to make their determination. I also found their final report on the subject: “Land Area Changes in Coastal Louisiana after Hurricanes Katrina and Rita.” (Here’s a link:http://pubs.usgs.gov/circ/1306/pdf/c1306_ch5_b.pdf). Bet you forgot about Rita, but yes there were two very destructive hurricanes affecting the Gulf Coast in 2005. The final report put the loss of wetlands from the two storms at a total of 217 square miles.


That sounds like a lot doesn’t it? But the reports from the Geological Survey put wetland loss from 1956 to 1978 in Louisiana at about 40 square miles a year. That’s an 880 square mile loss over 22 years. The Geological Survey also reports an approximately 35 square mile loss of wetlands per year from 1978 to 1990 for a 12 year loss of 420 square miles. Of course all these losses took years not hours to occur, but what is the reason for such incredible losses of wetlands?


People who are familiar with Louisiana and the great Mississippi River know the answer to that question. The Mississippi River isn’t really a river any more. It’s just a channel conducting water. The same goes for its major tributaries: the Missouri River, the Arkansas River, the Ohio River, and so on. Yes the mighty Mississippi, storied in American history and literature, is an over engineered navigational conduit to get goods from North to South and a pesky source of flooding to landowners along its length. The start of all the troubles began early, even before Mark Twain’s time as a steamboat captain. The steamboats went aground all the time in big piles of snagged trees in the middle of the river and on sandbars. So engineers devised ways to remove those snags and dredge the sand. But the real change for the Mississippi came after the flood of 1927, which was the beginning of the end for the free flowing great water body. I went back to the Army Corps of Engineers documents and also looked around at some of the National Research Council’s reports, but the best document I found on the channelization of the Mississippi came from a compilation report produced by the Geological Survey back in 2012. It is titled: “A Brief History and Summary of the Effects of River Engineering and Dams on the Mississippi River System and Delta.” (Here’s a link to the report: http://http://pubs.usgs.gov/circ/1375/C1375.pdf).  I like the Geological Survey’s reports. They are always well written, not like the mumbo jumbo you get out of some federal science agencies.


The report says that in 1927 about 43,500 square miles of land in 7 states was flooded and 246 people were killed. The flood of 1927 was kind of a legendary flood but most people today have never heard of it. All sorts of historic events are claimed to be a result of the flood, including the great migration of displaced African Americans from the Mississippi delta to northern cities and the election of Herbert Hoover as president of the United States based on his oversight of the flood relief efforts. (Presidents Hoover and Carter are the only engineers ever elected president). Basically a plan was implemented starting in 1929 to straighten out this flooding problem. And I do mean straighten out. Rivers are big complex bodies of water. They don’t have one channel, they have multiple channels. They meander over their floodplain. The basic mechanism creating meanders is high velocity water undercutting a river bank then depositing the sediment downstream on a bank on the other side of the river where the velocity of the water is lower. A program of cutoffs was instituted to reduce the number of channels and to cutoff large meanders. This program literally shortened the river. The lower Mississippi river lost some 145 miles as a result of this program. Then revetments were added to the banks of the Mississippi. Don’t know what a revetment is? They are essentially concrete mats that cover the entire bank of a river all the way to where it joins the submerged river bed.  Rip rap is also used. Back when the engineers were first seeking to control the river, they used a lot of rock and matting. The idea is to stop bank erosion and keep the river from migrating.


There were already levees before the time of the 1927 flood. Now there are miles of levees. You probably remember seeing them on television during the Katrina hurricane coverage. They are tall, wide compacted, earthen dam like structures that parallel a river. The Geological Survey says there are 3500 miles of levees just in the lower part of the Mississippi River Basin. There are levees everywhere in Louisiana on the banks of the Mississippi. In New Orleans you can stand on the ground in some areas and see the levees towering overhead with the river at the crest of the levee and a cargo boat steaming by above you. The levees are there to keep the river from flowing into its’ floodplain when water in the river is high. They also starve the floodplain of sediment and nutrients.


The other types of engineering control you’ll find on the Mississippi River are floodways and dikes. You’ll see floodways in New Orleans and other towns on the Mississippi River. They are there to redirect flood waters from the river away from a city into an area that is not quite as populated. They are big structures and the lower Mississippi in Louisiana has three really large ones. Dikes are just like the dikes you see sticking out into the ocean when you go to the beach, but on rivers they are usually protruding at an angle from the river bank. The purpose of the dikes is to direct the strong currents away from the bank to prevent erosion and meandering. What results is a strong current right down the middle of the river which scours out the river bed sediments and actually makes the river deeper.


One thing you won’t see on the Mississippi River thank goodness is a dam, at least in the lower part of the river. The upper Mississippi has a series of navigational locks and dams starting around Minneapolis that extend down to the Missouri River. All the main tributaries to the Mississippi have dams though. The Missouri river has six big ones. The Missouri River is essentially a system of reservoirs interspersed with channels. Again the dams provide flood control, but the big thing they prevent is sediment moving down into the Mississippi River. The Geological Survey says that the dams on the Missouri River have resulted in an enormous amount of sediment from reaching the Mississippi River and subsequently the floodplain wetlands in Louisiana. I didn’t realize that the Missouri River was the greatest contributor of sediment to the Mississippi from any of its tributaries. The Missouri drains the Great Plains and includes flow from the Arkansas and Red River Basins. Due to the semi-arid environment and lack of vegetative cover to stabilize soils, there is a lot of erosion. You would think with the dry climate there wouldn’t be a lot of transport of the sediment, but apparently rains during the fall are sufficient to wash those sediments into the Mississippi. Or at least that’s what used to happen. Now with all those dams, the sediment is just sitting there filling up the reservoir behind the dam and starving the downstream wetlands.


The Geological Survey report says that only about 40 % of the sediment that used to be transported by the Mississippi River makes its way to the Louisiana coast now. No wonder there is such a big loss of wetlands. Add in all those levees in south Louisiana preventing the river from connecting with the floodplain wetlands and you get essentially what I would call an ecological disaster in the making. Here’s something even worse though, although the Missouri River provides the lion share of sediment to the Mississippi River, it only contributes about 12 percent of the water. Half of the water going into the Mississippi comes from the Ohio River. Well of course, there is a lot more rain in Ohio, Illinois, Indiana, Kentucky, Pennsylvania and West Virginia through which the Ohio River flows than the states through which the poor old Missouri River flows (Montana, South and North Dakota, Nebraska, Kansas and Missouri).  But you know what exists along the Ohio River – lots of farms with soybeans and corn and lots of farms with cows and pigs and other animals. What with all the fertilizer and manure runoff, the Ohio is the largest contributor of nitrogen to the Mississippi River. If you have been reading my posts on the Clean Water Rule, you will know that wetlands are a great means of removing nitrogen from water. You disconnect the river from the floodplain and wetlands and all that nitrogen goes down and empties into the Gulf of Mexico. What happens next is famous – the Gulf of Mexico dead zone. All this nitrogen pouring into the Gulf results in a massive growth of phytoplankton which depletes the oxygen in the water and results in fish kills. The Geological Survey report said that in 2002 the dead zone in the Gulf of Mexico was as large as the state of Massachusetts.


So there you have the result of a river not being a river anymore. Dams exist on so many of our major rivers and have forever altered the landscapes downstream. I will be looking at the scientific literature on dams over the next few months and writing about the impacts to water quality and morphology of landforms.

Clean Water Rule: A Review of the Environmental Protection Agency’s “Connectivity of Streams and Wetlands to Downstream Waters” Post 4 – Non-Floodplain Wetlands

I am a big hiker. I love to hike and I have hiked all over the United States and much of the world. There is nothing better than taking off with your backpack and a tent and spending days on the trail enjoying nature. It has given me an opportunity to get a close look at many different watersheds and wetlands. One of my husband’s favorite stories about me took place while we were hiking the Coast to Coast trail in northern England. We were picking our way up a hill through a bog, when I stepped on a patch of the bog that was not solid enough to handle my weight and I sank down to my waist. He had to pull me out all dripping wet and dirty. Vertical bog? Yes, it rains constantly in some areas. I have some cities on my smart phone weather app that no matter when I look at them, it is raining there. Maybe it’s not a hard rain, but it just rains and rains. If you want to hike in northern England and Scotland get yourself a good rain suit. You will need it.  In these areas the water may runoff a little bit, but much of it just soaks into the soil and vegetative mass and forms bogs. Bogs are non-floodplain wetlands.


Other types of non-floodplain wetlands are also on hillsides. They are called slope wetlands by some people, but I’ve always known them as seeps. I see them when I’m hiking in the mountains all the time. Mostly they are small but I have seen some pretty large ones too. Just this spring I walked over boards through a seep wetland. I must have hiked about a quarter of a mile on those boards. Seeps are groundwater fed and are usually found at slope breaks, at the contact of two geological formations, or where the water table is really high.


I’ve also worked in many remote areas of the United States and around the world. I worked in South and North Dakota for awhile. While I was there I got an opportunity to drive through some of the prairie pothole areas in North Dakota and get out and take a look. It is a fascinating continental glacial terrain. Apparently those continental glaciers were huge. In places geologist estimate continental glaciers were several miles thick. That’s a lot of ice. And a lot is going on with those continental glaciers. They move, although very slowly. They are grinding up the countryside underneath them and pushing it in front of them. They have channels of water running through them and on top of them. They spread out and then retreat leaving frozen blocks of ice behind in unsorted glacial silt, sand and gravel. The continental glaciers that covered large parts of the northern mid-west left an interesting terrain. There are broad mounds of glacial gumbo called moraines that run for miles. There are long sinuous ridges of well sorted glacial sands and gravels called eskers. There are symmetric and asymmetric depressions containing water called kettles. And the whole area is covered by several hundred feet of poorly draining glacial till. Many of these glacial terrains are characterized by non-floodplain wetlands, including what are called prairie potholes.


There are a lot of different kinds of non floodplain wetlands and EPA describes them in laborious detail in their report “Connectivity of Streams and Wetlands to Downstream Waters.” They describe non-floodplain wetlands which are simply topographic depressions and may or may not have surface water inlets or outlets, such as: kettles, potholes, vernal pools, playa lakes and Carolina bays. They describe a host of slope or seep wetlands including something called a fen. I actually had to look this one up in the dictionary. Fens are kind of like bogs but not as acidic so they support a lot of diverse vegetation. And further, EPA describes mineral soil flat wetlands which include relic lake bottoms, peat bogs, and the like. In other words there are a ton of different kinds of non-floodplain wetlands.


In my last post I discussed the findings of the Environmental Protection Agency’s (EPA) scientific assessment of the connection of floodplain wetlands to downstream waters. Today’s post looks at the connection between non-floodplain wetlands and downstream waters. This is the fourth in a series of posts which review the EPA’s report: “Connectivity of Streams and Wetlands to Downstream Waters.” EPA’s report is an assessment of the scientific literature published in peer review journals which present research on interactions within watersheds that affect “waters of the United States.” The report is the scientific support for the Clean Water Rule. If you have read the other posts in this series, you will know the Clean Water Rule, which was issued in the summer of 2015, defines “waters of the United States” under the Clean Water Act. The Clean Water Act allows regulation of the “waters of the United States” but never wholly defines it. As a result there have been various interpretations by regulators on what is covered as “waters of the United States”, which in turn have caused a lot of surprise for a few people who have filled in wetland areas and then received federal violations under the Clean Water Act.  Some of these surprises have ended up in the legal system and a few over the years have wound their way up to the Supreme Court. The Court has not been in the mood to define “waters of the United States” and why should they? It is really not their job. So EPA who has the responsibility for writing regulation and rules under the Clean Water Act took on the challenge.


EPA’s report “Connectivity of Streams and Wetlands to Downstream Waters” looks at the physical, chemical and biological connection of streams, floodplain wetlands and non-floodplain wetlands to determine if there is a “significant nexus” to downstream waters of the United States. “Significant nexus” are the words the Supreme Court used to tell EPA a connection must be established between wetlands and a river if wetlands are to be regulated as waters of the United States under the Clean Water Act. Establishing a clear connection between the hugely different and diverse types of non-floodplain wetlands to downstream waters using the scientific literature was probably EPA’s Waterloo for the Clean Water Rule. As the report describes it, in the case of non-floodplain wetlands, there can be a range of connectivity. The connection can be permanent, but it can also be occasional or rare. The connection can be by channels intersecting the wetlands and downstream waters or through groundwater flow. Sometimes the wetlands are connected to downstream waters only through connection to other wetlands. And sometimes non-floodplain wetlands are completely isolated and have no connection to downstream waters.


But where there are connections, even when the connection is only occasional or rare, the connection can have a significant impact to downstream waters. EPA cited one study in Maine that showed non-floodplain seep wetlands were providing 40 to 80 percent of baseflow in downstream waters. Another study EPA cites is on vernal pools in California. Vernal pools are usually dry; they only fill up during heavy rain months or when there is a lot of snowmelt. The study showed that water from the pools spilled into downstream channels 60 percent of the time water filled the vernal pools. A study of Carolina bays showed there were intermittent seasonal surface water connections to streams when water tables were high in the spring and fall. A study of depressional wetlands on the Texas Gulf coast showed there were connections to downstream waterways through surface runoff. There’s even a study showing prairie potholes can be connected temporarily to other potholes through surface water flow during really wet years.


Similar to floodplain wetlands, non-floodplain wetlands help reduce flooding in downstream rivers and streams. Surface flow from snowmelt or large rain events is caught and “stored” by non-floodplain wetlands, but not in all cases. EPA cites several studies where non-floodplain wetlands in permafrost areas and seep wetlands provide no storage of water. And even where non-floodplain wetlands are directly connected to downstream waters if the wetland is already saturated, then there is no ability for it to retain further moisture and reduce downstream flooding.


And just like floodplain wetlands, non-floodplain wetlands have the ability to remove and transform nitrogen and phosphorus. Even if the non-floodplain wetland is not connected to downstream waters, the vegetation in wetlands are busy slurping up nutrients for growth and energy, micro flora and fauna are breaking down organic material, and sediment from surrounding areas is piling up. If the non-floodplain wetland is connected to downstream waters than all the same benefits provided by floodplain wetlands in reducing nitrogen and phosphorous runoff into streams and rivers applies. If the non-floodplain wetland isn’t connected to downstream rivers and streams, well guess what, the benefit is still there. Non-floodplain wetlands are reducing overland run-off, full of nitrogen and phosphorous, which would eventually end up in rivers and stream. EPA cited one very interesting study that found some depressional wetlands absorbed two times as much phosphorous as floodplain wetlands.


And what are the bugs and frogs up to? All sorts of flying insects that you find in floodplain wetlands are breeding in the non-floodplain wetlands too: mayflies, caddisflies, diving beetles, backswimmers, whirligig beetles, waterstriders, waterboatmen, crane flies and midges. If you are a fly fisherman you probably know these bugs. So unconnected wetlands are still providing food for fish. EPA says the use of frogs of non-floodplain wetlands and their connection to populations of frogs downstream is well documented in the scientific literature. Also apparently is the connection for alligators. I guess if you fly or hop or crawl or walk, you don’t have to worry about a triviality like running water.


In the end EPA made some observations based on their findings about non-floodplain wetlands and I would like to quote them but in the interest of brevity, for which most scientists are not famous, I’m going to summarize it. Basically non-floodplain wetlands (as we’ve seen in this post) are extremely diverse and even if you think a wetland is isolated it might not be (just because it looks that way on a map or satellite image doesn’t mean it is isolated if data quality of the image isn’t good or if the view is obscured by vegetation); and some non-floodplain wetland complexes could have a connection to downstream waters through channels even if individual non floodplain wetlands within the complex are isolated. So to wrap it up, EPA kind of said: it’s complicated.


And unfortunately it is complicated. In college I was taught about the hydrosphere and the hydrologic cycle. Water precipitates from the sky, it falls on the ground, and it runs off into wetlands, streams and rivers which in turn run into the ocean. Or rainwater soaks into the earth and becomes groundwater which is stored in an aquifer or moves slowly through the rock and discharges into a seep or a stream or a river. Water evaporates from wetlands, streams, rivers and oceans and form clouds. Then it starts all over again as it rains once more. So loosely, you might say every drop of water connects with every other drop of water in some way. Trying to disconnect all that water through defining the “waters of the United States” is obviously a challenge.


Just an update for those of you who have been following the legal battle on the Clean Water Rule. Last week on October 9, 2015, the Sixth Circuit Court of Appeals in Cincinnati, Ohio issued a nationwide stay in the implementation of the Clean Water Rule. You may remember the Clean Water Rule was effective back on August 28, 2015 and that a North Dakota Court similarly blocked implementation of the Rule almost immediately afterward. This earlier injunction was only applied to the 13 states that were plaintiffs in that case. So 18 other states petitioned the Sixth Circuit Court of Appeals to block implementation of the Clean Water Rule nationwide while challenges to the Rule wind their way through the legal system. I read the Sixth Court’s decision and was particularly pleased to see the following statement which acknowledges the science and expertise EPA brought to the task of writing the Clean Water Rule:


“Given that the definitions of “navigable waters” and “waters of the United States” have been clouded by uncertainty, in spite of (or exacerbated by) a series of Supreme Court decisions over the last thirty years, we appreciate the need for the new Rule. See Rapanos, 547 U.S. 715; Solid Waste Agency of N. Cook Cty. v. U.S. Army Corps of  Engineers, 531 U.S. 159 (2001); United States v. Riverside Bayview Homes, Inc., 474 U.S. 121(1985). In one sense, the clarification that the new Rule strives to achieve is long overdue. We also accept that respondent agencies have conscientiously endeavored, within their technical expertise and experience, and based on reliable peer-reviewed science, to promulgate new standards to protect water quality that conform to the Supreme Court’s guidance. Yet, the sheer breadth of the ripple effects caused by the Rule’s definitional changes counsels strongly in favor of maintaining the status quo for the time being.”


Clean Water Rule: A Review of the Environmental Protection Agency’s “Connectivity of Streams and Wetlands to Downstream Waters” Post 3 – Floodplain Wetlands

Picture if you will, a river flowing through the countryside with farms and forests alongside its banks. Imagine you are on a boat floating down that river. Look as you pass the tributaries coming into the river. See cows and barns in the distance. Notice the erosion along the banks of the river. See shallow waters lapping along sandbars and mudflats which sometimes trail along the sides of the banks. Pass a tangle of forest with bushes and vines and trees overhanging the river. Notice the banks tapering away and a marsh with reeds appearing. Watch as another forest comes into view, this time with trees standing in shallow water then gradually transitioning into trees standing in mud left behind from when the river was higher, maybe back in the spring when there was a flood. Pass back into the sunlight as the bank rises again and more farmland appears.

Then imagine what the same landscape looks like from overhead as if you were floating by in a hot air balloon. Acres and acres of land are set out below you, with a long and wide sinuous river wandering through it. You see the square plots of farmland and the little dots of farm buildings. You can’t see the cows from up here. Look at all the forests and swamps along the banks of the river stretching far into the farmland. You can see all the vast network of tributaries entering the river. You can see some of them entering directly into the river. Others go into and wind through the marsh before flowing into the river. Sail over state forest land running for miles along and away from the river, disappearing into the horizon. What you are looking at from up here in the hot air balloon is the watershed of the river. You may not see all of it, because it is a big river with no other large water body in sight. But up here, you can see the tributaries all branching off of the river which means all the water in the area is going into the river. That is a simple way hydrologist often define watershed: it is an area where all the surface water is flowing into the same place; in our case here – a river. Water washes off the forest land, it washes off the farm, it enters a tributary, and it goes out into the river. Watersheds can be large or small. In fact, the U.S. Geological Survey has coded them by size in their system of Hydrologic Units that covers the United States. Marshes and forested wetlands are an integral part of the watershed.

The Environmental Protection Agency’s (EPA) January 2015 report “Connectivity of Streams and Wetlands to Downstream Waters: A Review and Synthesis of the Scientific Evidence” looks closely at wetland features adjacent to rivers in order to determine if they have a  “significant nexus”  to the chemical, physical or biological integrity of downstream waters of the United States. “Significant nexus” are the words the Supreme Court used to tell EPA a connection must be established between wetlands and a river if wetlands are to be regulated as waters of the United States under the Clean Water Act. The Supreme Court has taken up a number of cases over the last fifteen years where plaintiffs have sued the United States because of federal Clean Water Act violations they received for filling in wetlands. Dredge and fill regulations under the Clean Water Act are actually handled by the Army Corps of Engineers not the EPA. But EPA is largely responsible for writing the rules and regulations under the Clean Water Act. So the EPA took on the challenge that the Supreme Court gave them and issued what the EPA calls the Clean Water Rule. The Rule seeks to define the waters of the United States. In order to write the Rule, EPA prepared a scientific report containing the summation of their review of thousands of research papers by scientists in many different fields of study from hydrology to biology who have examined and researched watersheds all over the world.

Today’s post reviews the section of EPA’s report examining wetlands adjacent to a river; the ones we have seen in our boat trip and our cruise in the hot air balloon. These adjacent floodplains can be permanent low lying wetlands or temporary wetlands during a flood. Wetlands, which we often refer to as marshes or swamps, and found in the floodplain of a river or stream, are called riverine wetlands. Some people call them riparian wetlands. And although they can be reed filled or filled with scrub and shrub, they are mostly known for supporting forested wetlands (often called forested swamps). These types of wetlands have been studied endlessly for a long time. There is a huge body of scientific work that documents them. There is even a classification system for them. What EPA was looking for, in this large body of research dating back to the 1960’s, was data that shows the connection of riverine wetlands to their rivers. You would think, just by them being called riverine wetlands, they would have a connection to the river, wouldn’t you? But EPA needed to document the physical, chemical and biological connection in order to write their Clean Water Rule.

One of the chief things that EPA set out to document was the hydrologic connection between the wetlands and the river. Many of these wetlands are inundated during flooding. As you can imagine, a scientist could probably find a lot of grant money for this type of research. People are interested in floods; generally because they don’t want them. The slowing of flood waters downstream by riverine wetlands is well documented in the scientific literature. Water during a flood goes over the river bank into the floodplain wetlands. The wetland hangs on to that water and keeps areas downstream from flooding worse than if the wetland didn’t exist. In fact, that was the big talk after Hurricane Katrina. Scientists determined that floodplain wetlands had been reduced so much in Louisiana that they no longer had the ability to moderate flooding. One of the big projects going on right now in Louisiana is the attempt to restore the floodplain wetlands. Scientists can approximately calculate the floodwater that can be stored in a riverine wetland based on the number of acres and so forth. Once the flood stops, water in the wetlands can flow back through the soils and through channels into the river. It is kind of a two way street. Water goes in and water comes out.

Water in watersheds doesn’t move just through channelized bodies, there is a lot of overland flow moving into the whole watershed system. Some of this flow can come off of farmland in the case of our watershed, or in a less attractive and more urban environment it can come off of city streets and other paved surfaces. The great thing about floodplain wetlands is that they serve as a kind of buffer for the deposit of sediments from agricultural lands. EPA cites one study that showed wetlands were removing greater than 80 percent of sediments leaving agricultural fields in North Carolina. That kind of removal really helps streams from being overwhelmed with sediment. Of course we know that rivers overtopping their banks can bring a lot of sediment out of the river during a flood and deposit it in the wetlands and other areas adjacent to the river. I think we’ve all studied, at some point in our elementary school education, the River Nile and how thousands of years ago flooding which deposited sediments in the land adjacent to the river made the Nile valley a hugely fertile agricultural area and gave birth to a major civilization. Or maybe people don’t study that in school anymore.

A major connection EPA documents in their report is the influence floodplain wetlands have on nutrients entering a watershed. The big three nutrients in water are nitrogen, carbon and phosphorous. All three are needed for a healthy biologic community, but when they get out of whack in a river system, it can create problems with oxygen levels and result in fish kills and unhealthy streams. EPA cites recent studies looking at how riverine wetlands adsorb these nutrients in organic matter and sediments, how they are taken up by the living vegetation and animals in the wetland, and how they are transformed into other compounds by microbes that live in the wetlands.  All of these processes reduce the amount of nutrients entering a river system. So wetlands provide a useful service to improve water quality. EPA’s report cited a recent study in which scientists calculated that three fourths of the nitrates in runoff from Maryland agricultural fields are removed by forested wetlands. Another study was cited that showed forested wetlands in Georgia removed 65 percent of nitrogen and 30 percent of phosphorous from nearby agricultural fields. These wetlands are providing a significant service in the health of our river systems.

Another service riverine wetlands are providing to the river system is the input of carbon to the food chain for the vast amount of biological life living in the watershed. You know carbon. We are carbon based life forms on this planet, including the plants and the trees. Carbon is a major nutrient. Lots of carbon forms in floodplain areas where algae and microorganisms enjoy the huge supply and multiply unchecked. They in turn are a great source of food for wetland biologic communities like insects, who are then eaten by fish, frogs and the like. These wetland sources of carbon also flow from the wetland into a river and are a source of nutrition for downstream bugs.

EPA also looked at biological connections in their scientific assessment. What and who lives in floodplain wetlands and what connection do they have to the adjacent rivers and streams. One thing that we noted on our earlier tour of the riverine environment is the diverse aquatic vegetation. There are also microscopic plants living in the wetlands too – all sorts of phytoplankton. Both types of plants move from wetland to river system and beyond. Seeds are transported out of wetlands and move downstream to seed other areas. Phytoplankton move easily with the water into and out of the floodplain areas.

Insects, crayfish and mollusks are all living in the wetlands too as well as microscopic invertebrates – zooplankton like copepods. EPA looked at studies during their assessment which showed that the greater the connection between a river and a floodplain wetland, the greater the abundance of invertebrates. You might not care, but the fish and the frogs sure do. Even just periodic flooding allows dormant eggs of some invertebrates laid in floodplain areas to hatch, providing ongoing populations of those invertebrates. Flying insects such as katydids and their fellow fish snacks are more prevalent in a watershed when there are floodplain wetlands. You probably don’t care to know the scientific research, since you have probably experienced the increased numbers of flying insects yourself whenever you have been near a wetland. But just to let you know, there are people who set out sample trays in wetlands to count the vast hordes of the bugs living and breeding there.

All these great sources of food for fish and animals are just one way the floodplain wetlands benefit river systems. Fish and mammals regularly commute between rivers and wetlands. EPA cites numerous studies of fish movement between both environments in their hunt for food, their need for breeding and rearing habitat, or just to take refuge when they are having a bad day. And mammals, well they get out of the river and use wetlands too. One study referenced by EPA said otters poop in the wetlands. Really I am not making this up.

EPA says the scientific evidence is strong that there is a physical, chemical and biological connection of rivers to floodplain wetlands even when the wetland is infrequently inundated by water. I think we clearly can see the connection in how a floodplain can store water and reduce flooding, how they can store sediment and nutrients, and how back and forth flow can affect both the river and the wetland and all the critters therein. I think EPA can declare victory on establishing the connection between rivers and riverine wetlands through their assessment of the scientific literature.

My next post on the science report behind the Clean Water Rule will be EPA’s greatest challenge yet: the assessment of the connection between river systems and non-floodplain wetlands.