Tag Archives: Groundwater

Groundwater refers to water resources in the subsurface below the water table in both soil and rock.

What About the Floridian Aquifer in Georgia?

After my last post on whether the Floridian Aquifer in Florida was in water bankruptcy (according to the definition from the United Nations University Report entitled Global Water Bankruptcy) I was contacted by a reader of this blog from Georgia. He gets his water from a small municipal system supplied by wells into the Floridian aquifer. I explained in my first post on the Floridian: An Aquifer is All About Its’ Geology that the Floridian aquifer extends into southern Georgia, South Carolina and Alabama. The situation in Georgia where my reader lives is quite a bit different from Florida. Let’s take a look and see if the Floridian in Georgia could be classified as being in water bankruptcy.

As usual when discussing an aquifer we’ll start with the geology. The Georgia and South Carolina parts of the Floridan aquifer are at the northern most edge of the broad carbonate platform that underlies much of Florida and the adjacent Coastal Plain. The Eocene and Oligocene limestone and dolostone formations of the Floridian dip and thicken towards the coast with more purely limestone and dolostones of Eocene and Oligocene age. The main formations are the Ocala limestone and the Suwannee Limestone which were deposited in shallow marine environments as lime muds, skeletal debris and reef and shoal deposits.  After burial and consolidation, the carbonates were altered by recrystallization and through carbonate dissolving along fractures – similar to the Floridian’s formations in Florida. Up dip, toward the Fall Line where coastal sediments meet the metamorphic and igneous rocks of the Piedmont the carbonate formations become thinner, more discontinuous, and increasingly mixed with siliciclastic sediments.

The aquifer is overlain by younger rock formations comprised of clay, silt, sand, phosphates, and unconsolidated surface deposits of Miocene, Pliocene, Pleistocene, and Holocene age that serve to confine the aquifer and restrict surface recharge. The formations of the Floridian in Georgia are recharged where they outcrop at the surface near the Fall Line.  This is very different from Florida where formations of the Floridian outcrop over much of the surface of the state and water recharge to the aquifer is direct. Because of this indirect recharge, water that enters the Floridian aquifer near the Fall Line takes thousands of years to reach the coast. I hope people who use the water along the coastal plain think about that when they leave the tap running.

Just as in Florida, the aquifer is divided into the Upper and Lower Floridian. Intervening between the carbonate formations comprising the Upper and Lower aquifer are marls and siliclastic rocks; however, they are not continuous throughout Georgia and sometimes the Upper and Lower Floridian are connected. And just like Florida, the Upper Floridian is the more prolific of the two with much better water quality, although still “hard”, containing high levels of calcium and magnesium.

The Upper Floridian has been a traditional source of water in Georgia for municipal, agricultural and industrial needs. Unfortunately, that all had to change. The reason: saltwater intrusion. I discussed saltwater intrusion in my blog on the Floridian aquifer in Florida. You can read it here ( IS THE FLORIDAN AQUIFER  SUFFERING WATER BANKRUPTCY?  ). In short, the formations of an aquifer do not stop at lands end. No, they continue on beneath the ocean. In Georgia it is fortunate that the formations of the Floridian are overlain in most places by fairly thick overlying rocks, so saltwater from the ocean does not intrude into the aquifer. Not so in South Carolina. Hilton Head is the offending area. The local absence and erosion of these overlying rock formations have resulted in saltwater intrusion.
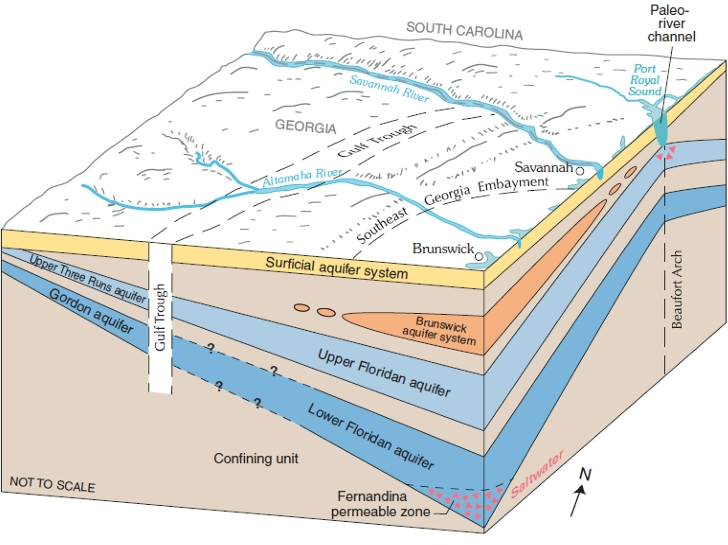
As you can see from the figure above taken from the Georgia Environmental Protection Division website, the area called the Beaufort Arch is where the problem exits. In the past when sea level in the Hilton Head area, including the Calibogue Sound west of the island, was lower ancient rivers cut right through the overlying rocks and formed channels. Later these channels filled with younger porous sediments. These channels can act as conduits for seawater to move downward into the Upper Floridian aquifer.

This might not sound like all that much of a problem, but because the Floridian aquifer was so overused on the southern coastal plain in Georgia it resulted in water in the aquifer moving from South Carolina towards the centers of pumping in Georgia. All sorts of towns and municipalities in Georgia, including Savannah and Brunswick, used the Upper Floridian aquifer as their main source of water. Before this large-scale groundwater development, freshwater in the Upper Floridan aquifer moved generally from inland recharge areas in South Carolina toward the coast and discharged upward or seaward. Under those natural conditions, artesian pressure helped keep saline water offshore or beneath the freshwater system. Hilton Head had increased vulnerability because the island lies close to Port Royal Sound, Calibogue Sound, and other saline surface-water bodies that overlie or border parts of the Floridan aquifer system there. It’s not all Georgia’s fault though, after all Hilton Head Island also was withdrawing water from the Upper Floridian which lowered the water table and reversed the aquifer’s natural seaward hydraulic movement. United States Geological Survey studies of Hilton Head have clearly shown how declining aquifer pressure changed the groundwater flow direction beneath the island. Instead of freshwater consistently moving toward Port Royal Sound, portions of the aquifer began moving landward.

To add insult to injury for the Floridian aquifer in Georgia, over pumping in the Brunswick area has caused another type of saltwater intrusion. The Upper and Lower Floridian aquifers are more integrated in that area because of faulting and fracturing in the rock formations. The Lower Floridian is not of high quality. Due to over pumping this low-quality saline water was drawn upward into the Upper Floridian aquifer. The problem is most significant in downtown Brunswick.

During the 1980s efforts began in Georgia to prevent saline waters from destroying the Floridian aquifer. Georgia began limiting water withdrawals from the aquifer in the most vulnerable coastal areas, especially around Savannah. The major turning point came in 1997, when the Georgia Environmental Protection Division adopted the Interim Strategy for Managing Salt-water Intrusion in the Upper Floridan Aquifer of Southeast Georgia. The strategy covered twenty-four coastal counties and imposed caps or reductions in areas where additional pumping could worsen saltwater movement. It required areas around Savannah to reduce groundwater use by at least 10 million gallons per day by the end of 2005 and limited new withdrawals in other parts of the coastal area.

Georgia replaced the interim strategy with the Coastal Georgia Water and Wastewater Permitting Plan for Managing Saltwater Intrusion in 2006. The plan instituted a more detailed management system for the Floridian aquifer. In the Savannah area where saltwater encroachment from the Hilton Head side was a central concern, the plan continued to limit Upper Floridan withdrawals and encouraged the shift to alternative sources, including surface water. Savannah now gets its’ water from the Savannah River. Smaller communities with no access to surface water have very restrictive limits on withdrawal and major water conservation measures are in place.  In Brunswick where the saltwater plume was already wreaking havoc on water-quality, the plan preserved withdrawal restrictions. Brunswick has responded with conservation measures and drilling wells into less productive aquifers to supplement their water supply. And Hilton Head? Well, they have chosen to drill a very deep well into Eocene rocks. It’s poor water quality but they have added a desalination plant using reverse osmosis to treat it.

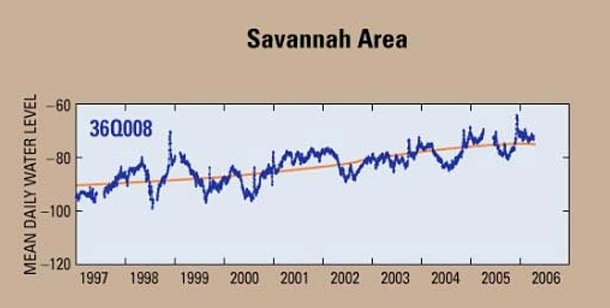
Is the Floridian in Georgia in water bankruptcy. I say no. Good management practices early on have disrupted such a catastrophe. This hydrograph from the USGS shows the rebound of water levels in Coastal Georgia after the institution of Georgia’s aquifer control measures.
 But the Floridian around Hilton Head in South Carolina might well meet the definition of water bankruptcy as once salinization occurs you’ve wrecked your water supply permanently.

IS THE FLORIDAN AQUIFER  SUFFERING WATER BANKRUPTCY?

Manatees enjoying a spring fed by the Upper Floridian aquifer

The 2026 United Nations University Report Global Water Bankruptcy frightened a great many people by declaring much of the world is currently in water bankruptcy – the state of water resources being so overused and degraded that they cannot be restored to their original condition and function.  It caused me to contemplate how much of our water resources in the United States are in this state of collapse. Might as well start with our most prolific, so I took a look at the Floridian aquifer in Florida. It is probably the country’s greatest aquifer and supports human consumption, agricultural irrigation, and industrial needs.

The Floridian aquifer underlies Florida, the southern parts of Georgia into coastal South Carolina, and parts of southern Alabama. It is a limestone aquifer and if you want to know something of its geology in Florida you can check out my blog post here ( The Floridian: An Aquifer is All About its Geology )The geology of an aquifer is important as it will tell you about flow, chemistry and a host of other important parameters. The Floridian aquifer through most of its’ extent is divided into an Upper Floridian aquifer and a Lower Floridian aquifer. The Upper aquifer is the good one which everyone likes to tap as the water quality is generally excellent and recharge from the surface and through karst features produces tons of flow. The Lower aquifer is confined in most areas by overlying thick formations of marls and siliclastics that restrict water flow into It from above. The water quality is also not very good and it is pretty deep, so drilling into it is costly for well development My attention then is solely on the Upper Floridian as to whether it is overused and degraded to the point where Floridians are going to be in trouble with water supply in the future.

The two major issues that could affect this mighty aquifer are karstification and salinization. Let’s look at the condition of karstification first. Karstification problems are most often caused by overuse. In other words, too much water in a concentrated area is being pumped out of the aquifer. Over pumping leads to increased solutioning of the limestone. Fractures, vugs and caverns all increase in size. In addition, over pumping causes the groundwater table to lower which can lead to collapse of the limestone formation. These collapsed areas are called sinkholes. Every once in a while you will see one on tv where a sinkhole has swallowed a house or road.

Most large cities in Florida have groundwater well fields where a number of wells have been drilled into the Upper Floridian.  When water is pumped from these well fields it produces what is known as drawdown. Water rushes into the screen of the wells and is pumped up to be stored above ground. As the water is pumped from near the well, water further from the well is drawn toward it. A cone of depression around the well is formed. The more the well is pumped the greater the cone of depression becomes. The water table will begin to lower, and the limestone once supported at the surface by the water begins to collapse.

One of the classic examples of well-field-related sinkhole problems comes from the municipal well fields north of Tampa. The U.S. Geological Survey documented that this Gulf Coastal Plain area was already densely pitted with natural sinkholes and sinkhole lakes, and  yet water authorities continued over pumping from the municipal well fields causing abrupt drops in groundwater levels. The surface began to collapse. Eventually many of the wells in the field were abandoned and to prevent further collapse pumping levels were curtailed. Alternative sources of water had to be added including river water, stored reservoir water and desalinated seawater to restore water supply to the city.

Salinization of the Upper Floridian is the other big threat to the aquifer. Salinization is the fancy scientific name when saltwater either from the ocean or from lower saline aquifers begins to intrude into a freshwater aquifer like the Upper Floridian. I’m always saying that every drop of water connects to every other drop of water on Earth, so salinization in coastal areas is quite common. The ocean and nearshore aquifers interact. If there is tidal flooding or a  drought then salt water from the ocean can intrude substantially into a fresh water aquifer.

But by far the greatest cause of saltwater intrusion into the Upper Floridian is once again over pumping. When water is withdrawn faster than it can be replenished, the pressure differential allows saltwater to migrate inland. This phenomenon is particularly pronounced in highly populated areas and agricultural areas undergoing extensive irrigation.

Saltwater intrusion compromises the quality of drinking water by increasing salinity levels. Elevated salt concentrations pose health risks and can render groundwater unsuitable for consumption without costly treatment. Using saline water in agricultural operations can damage crops sensitive to salinity and in the long term result in salinization of soils rendering them infertile as nothing will be able to grow there.

Miami-Dade, Broward, and Palm Beach counties in south Florida are among the most severely impacted by saline intrusion. Dense urban development, high water demand, and proximity to the coast have accelerated salinization of the Upper Floridian aquifer. In southwest Florida the cities of Naples and Fort Myers face salinization of both potable water supplies and agricultural irrigation wells. In Miami-Dade County, saltwater intrusion has led to the closure of several municipal wellfields and the construction of inland wells. Similarly, in Tampa Bay, increased salinity in groundwater has necessitated investment in desalination facilities.

Unfortunately once saline water intrudes into an area, it can’t be reversed. Prevention is the only management strategy available. The state of Florida’s Environmental Protection Division and its’ five water management districts have teamed up with the U.S Geological Survey to put a prevention plan in place. A major component of their plan is to set Salt Water Intrusion Minimum Aquifer Levels, often called SWIMALs, for vulnerable areas of the Upper Floridan aquifer. These levels are designed to maintain enough freshwater pressure in the aquifer to slow or prevent regional saltwater movement. Another part of the state’s response is reducing dependence on fresh groundwater. The Florida Department of Environmental Protection recognizes that groundwater withdrawals cannot continue to grow indefinitely without unacceptable impacts, including saltwater intrusion, reduced spring flows, lower lake levels, and wetland losses. As a result, the state promotes alternative water supplies such as reclaimed water, brackish groundwater, seawater desalination, stormwater, surface water, conservation projects, and aquifer storage and recovery. Florida is also experimenting with aquifer recharge projects that can help slow saltwater intrusion by increasing freshwater pressure in the aquifer. Hillsborough County provides a practical example. Working with the Southwest Florida Water Management District and the Florida Department of Environmental Protection, the county has developed coastal recharge projects that inject highly treated reclaimed water into a non-drinking-water portion of the aquifer near the coast. The goal is to create a freshwater barrier between saltwater beneath Tampa Bay and the freshwater inland, while also supporting higher groundwater levels upstream of the recharge area.

So having examined the facts about damage to the Floridian aquifer in Florida can we say that the aquifer is in water bankruptcy. I think not. Salinization is localized and  management strategies are in place. The Floridian aquifer will continue throughout most of its extent to be a prolific water resource.

The Floridian: An Aquifer is All About its Geology

Is The Floridian Aquifer in Florida in Water Bankruptcy?

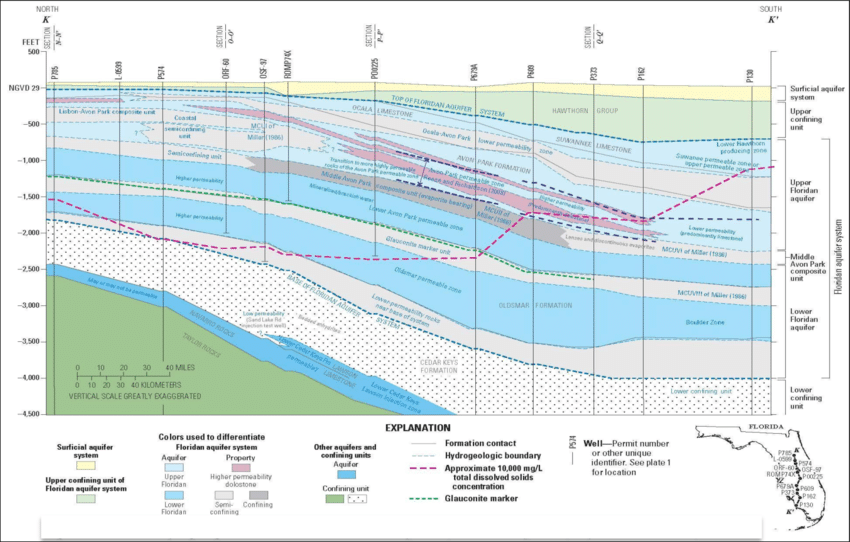
United States Geological Survey: Crosseection of the geology of the Floridian aquifer

Florida is a big state of some 66,000 square miles and it has a lot of people, nearly 25 million. About half of them depend on the Floridian aquifer as a water source. The interesting thing is most of the people who live in Florida are not from Florida. They are from big cities up north that primarily get their water from rivers. The majority of people in Florida if asked would probably not be able to say where their water comes from and after all why should they worry, as good grief, it seems to be plentiful. It’s not like California where there are all sorts of water restrictions and you have to landscape your yard with ugly white stones instead of grass. No when a Floridian turns on the tap they let it run.

The water may be plentiful but it is deemed hard by water treatment specialists. That’s because of the geology of the Floridian aquifer. To understand an aquifer you must understand the geology. Looking at Florida on a map you see that it looks like a tail wagging the dog of the North American continent. If you look at it from the air, it looks very, very flat. This is a result of how it was formed. Some 200 million years ago the supercontinent of Pangea began to break apart. As the North American continent slowly headed towards its present day position a shallow sea developed between it and the African continent. This shallow sea was an optimum place for the deposition of carbonate rocks and siliciclastic sediments. Thick sequences of interbedded limestone, clays and sandstones accumulated throughout the Cretaceous and on into the Cenozoic geologic time periods as the continents moved further apart.

 During the Paleogene, about 60 million years ago, movement of the continents began to settle into what we might recognize on our current world map and the area where Florida exists today was a shallow marine platform beginning to form the tail of the North American continent. The era was characterized by rising and subsiding seas. Geologists call these transgressive and regressive sequences. So when the seas were high carbonate and siliciclastic rocks formed and when the seas were low the rocks were exposed, leading to what is called karstification –  an interesting type of erosion where limestone is slowly dissolved by water as it percolates through the rock creating, vugs, channels and caverns.

Thick cumulation of sediments were continuously being buried by further deposits of sediments. As a result the underlying sediments began  to compact. The low temperatures and pressure from this compaction as well as the infiltration of meteoric waters altered the rock. In some cases the rock would become dolostones as magnesium replaced calcium in the mineral structure and in other cases secondary porosity such as fracturing and solutioning would develop.    

Lack of any substantial movement of the carbonate platform through faulting, or subduction/abduction of the continental plates led to only minor amounts of deformation of the area. There are only a few gentle geologic highs, like the Peninsular Arch which trends northwest to southeast and the Ocala Platform in north central Florida.

The major stratigraphic units of the Floridian aquifer were formed during the Cenozoic from about 60 million to 20 million years ago. From oldest to youngest they are the Oldsmar Formation, the Avon Park Formation, the Ocala Limestone, and the Suwannee Limestone. The Oldsmar formation is mainly dolostone and clayey carbonates that were deposited in the shallow restricted depositional basin. The Avon Park Formation is composed of interbedded limestone and dolostones with abundant karstification denoting its formation in the era of transgressive/regressive seas. The Ocala Limestone is the most continuous formation throughout Florida of the units that compose the Floridian aquifer. It Is composed of thick limestone layers formed in the offshore environment. The Suwannee Limestone is characterized by a fossil laden limestone formed in the shallow marine environment. These rock units are variable in thickness but reach greater than 1000 feet in north and central Florida.

This is a lot of aquifer. In north and central Florida where the aquifer is at its thickest, it transmits a ton of water throughout its continuous expanse. Recharge of the aquifer is direct and extensive. Some of the most prolific springs in the world are in this area. People today flock to the beaches in Florida but at one time the springs were one of its biggest tourist attractions. Go today and you can often see manatees making the springs their home.

Southern and Coastal Florida have a thinner sequence of the carbonate rocks and more siliclastic units forming thick sequences of rock where there is little recharge to underlying aquifer units. These barriers to water transmission are called confining zones and the Hawthorn Formation is its greatest representative. In the panhandle of Florida and along the Gulf and Atlantic coasts these siliciclastic rocks units dominate.

So the Floridian aquifer is a product of its geologic formation. Its thick sequences of interbedded sedimentary rocks and karstification is why it is so prolific in some areas and not others. Its dominance by limestone and dolostone is why the water is contains so much calcium and magnesium bicarbonate and is dubbed “hard”. Its predomiantly siliclastic nature near coastal areas and at depth result in fresh groundwater mixing with more saline or brackish waters making it less productive as a water source. But without the Floridian aquifer the state of Florida would not be able to maintain a population of its size. It is one of the greatest aquifers in the world.  

Is the World Really in Global Water Bankruptcy?

The recently issued United Nations University Report Global Water Bankruptcy says: “The world is already in the state of “water bankruptcy”. In many basins and aquifers, long-term overuse and degradation mean that past hydrological and ecological baselines cannot realistically be restored. While not every basin or country is water-bankrupt, enough critical systems around the world have crossed these thresholds.”  

Strong words and new words. What do they mean by “water bankruptcy?’ The term is defined in the report as the critical condition in which water resources are depleted or so severely mismanaged that they can no longer meet the essential needs of populations, ecosystems, and economies. The conclusion that we are now bankrupt is based on statistics. Very interesting. Not scientific proof, just statistics.

For example, the report says that nearly three-quarters of the world’s population live in countries classified as water-insecure or critically water insecure. Insecure is the mumbo jumbo word now used to mean insufficient. So, there is basically insufficient water for the population of these countries. The report also cites that about 4 billion experience severe water scarcity for at least one month a year.

 Groundwater is reported to now be the source of 50% of global domestic water use and over 40% of irrigation water and that around 70% of the world’s major aquifers are showing long-term declining trends. Excessive groundwater extraction has in turn led to significant land subsidence because when you extract water and lower the water table, aquifer materials such as sand and silt compact. Compaction basically destroys the ability of the affected acquirer to recharge itself with water. The report says that over 6 million square kilometers—almost 5% of the global land area— is subsiding due to groundwater extraction.

Our biggest source of water though is surface water – rivers, streams, and lakes. They cite that a growing number of major rivers now fail to reach the sea (like the Colorado River – see my blog post here An American River in Distress ) or fall below environmental flow needs for significant parts of the year. No statistics are provided here; it’s just based on anecdotal observation. The report goes on to say that more than half of the world’s large lakes have lost water since the early 1990s, affecting around one-quarter of the global population that depends directly on them for water security.

Very interestingly the report states that about 70% of the world’s global freshwater withdrawals are used for agriculture and that more than 170 million hectares of irrigated cropland are under high or very high-water stress meaning again that there is insufficient water for irrigation at times.

So, what does the report say is the cause of global water bankruptcy? People. Of course, they couch it in terms of the “Anthropocene” the word now used to mean the period of time since humans have started affecting their natural environment with their activities.

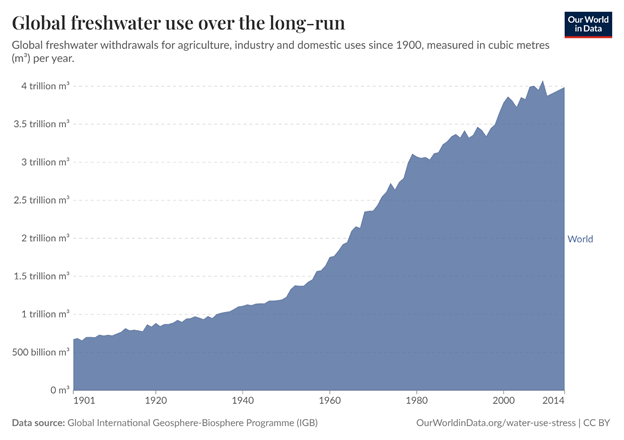
The chart I like best in the report is this:

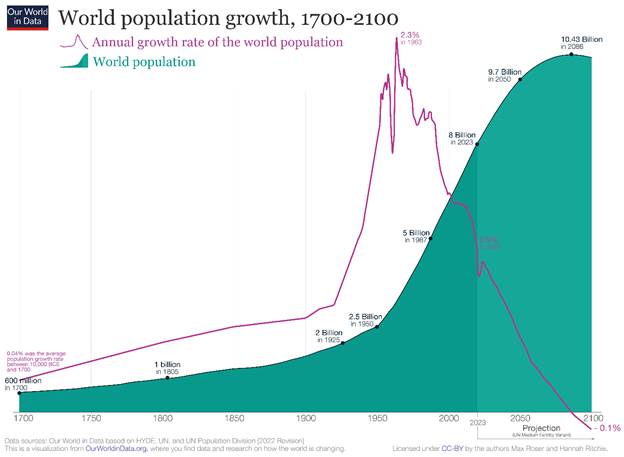
The chart shows the increase in freshwater use from the early 1900’s to today. Use rose precipitously starting in the 1960’s.  They should have put the chart below right next to it because it shows an identical increase in population:

Trends indicate that by 2030, demand for water is expected to outstrip supply by 40 percent, driven by population growth, urbanization, and increased agricultural and industrial use. Apparently water bankruptcy will be the norm. However, the report provides no scientific measures for determining when a water system is in bankruptcy. Case studies are cited but there is no definitive presentation of a way to classify a system as bankrupt. In my view this is the big failing of this report. It only coins a new term and attempts to define it but lacks rigor in its presentation. So, the question still remains: are we in the midst of global water bankruptcy?

I will attempt in my blog to look into large water supply systems and determine if they are indeed in a state of bankruptcy. I will start with one of the most prolific aquifers in the United States – the Floridian.

Hydraulic Fracturing: Movement of Gas and Fluid in the Subsurface

Today’s post looks at ways injected hydraulic fracturing fluid might move through the subsurface and contaminate groundwater. The information in this post is based on the U.S. Environmental Protection Agency’s (EPA) December 16, 2016 report: “Hydraulic Fracturing for Oil and Gas: Impacts from the Hydraulic Fracturing Water Cycle on Drinking Water Resources in the U.S.”


Wells are constructed to withstand the pressures applied during injection of hydraulic fracturing fluid. The fluid is mostly water and sand with on average about 1 % chemical additives. Wells are constructed by inserting steel casing down a borehole and cementing it next to the rock formation. The cement prevents fluid and gas from coming back up along the sides of the casing. State regulators generally require protection of groundwater resources and so casings are cemented (at a minimum) from the surface to below the groundwater zones. The goal of hydraulic fracturing is to inject solution down the hole under enough pressure to produce long horizontal and vertical fractures in the oil and gas formation. The sand in the solution then props the fractures open, so the gas and oil can flow out of the rock and up the interior of the casing to the surface. Once the pressure on the well is released, most of the hydraulic fracturing fluid comes back up the well and is captured in tanks for disposal. It is the fate of the fraction of fluid lost in the fractures which is a concern in EPA’s study. There are fluids and minerals already existing in the oil and gas formation. Some of these fluids and minerals come back up the well with the hydraulic fracturing fluid. EPA’s report examines whether these naturally occurring fluids and minerals can be activated by the hydraulic fracturing process and move through the subsurface. EPA is also concerned with whether the hydraulic fracturing process might cause gas in the targeted oil and gas formation or in the overlying rocks to move through the subsurface into groundwater.


Unfortunately the EPA has only been able to identify a limited amount of research on fluid and gas movement once an oil or gas well has been hydraulically fractured.

As a result there are a lot of limitations on EPA’s ability to provide any definitive conclusions on fate and transport of gas, hydraulic fracturing fluid, or naturally occurring groundwater and minerals through the subsurface. EPA examines two pathways fluids and gas might move into groundwater during and after hydraulic fracturing. The first pathway is a result of the age old method of human frailty, in other words, a bad well design or poor construction of the well. Also included in this pathway is the lack of permanence of human construction or your basic entropy – the eventual degradation of the steel casing or cement. The second pathway EPA examined is the movement of gas and fluid through the fractures created by hydraulic fracturing into naturally existing fractures, faults, and nearby operating or abandoned oil and gas wells, or in other words, unintended consequences.


What kind of scientific or technical evidence did EPA find to support the existence of these two pathways? First there’s the technical data EPA collected from the oil and gas industry, although it is incomplete. There is the research by non-EPA scientists who have examined data collected from the oil industry or who have produced independent data themselves, and then there is groundwater modeling. As someone who has conducted and used groundwater models, I always caution on the usefulness of this methodology. There are so many variables in the subsurface; it is often hard to use models as more than just a tool to assess the many probabilities which might occur. But in this case, groundwater modeling has provided some interesting and pretty definitive insights into what can happen to fluids and stray gas during and after hydraulic fracturing.


So did research show there are subsurface pathways through which groundwater contamination can occur during and after hydraulic fracturing takes place? EPA reviewed data collected from the oil and gas industry and found that in roughly 3 % of wells hydraulically fractured, there was a mechanical failure of the well. This means some fluid or gas may have escaped along the outside of the casing during the hydraulic fracturing process. Where it went is a guess. Just because the casing or cement failed, it doesn’t mean fluid or gas moved into groundwater. Only in about 0.5 % of these cases did the well not have cement or some other type of barrier protecting the groundwater. Of course there are some notable well failures which have contaminated groundwater, like the ruptured casing resulting in a large surface spill in Killdeer, North Dakota during 2010. Based on groundwater chemistry, scientists think there are also some hydraulically fractured gas wells in the Marcellus Shale in Pennsylvania which have contaminated drinking water resources with natural gas as a result of poorly cemented casing. And there’s another incident in Ohio where gas moving up the exterior of casing into groundwater was thought to have been caused by poor cementing. A number of oil and gas wells being hydraulically fractured are not new wells. Of the oil and gas wells EPA examined about 19 % were older wells. They ranged in age from 8 days to 51 years. EPA noted there were more casing and cement failures in these older wells. So yes there is a limited amount of data showing oil and gas wells being hydraulically fractured can fail and be a pathway for groundwater contamination.


What about movement of fluid and gas through new and existing fractures? What technical evidence did EPA find to determine if this was a clear pathway for contamination? Studies have shown that hydraulic fracturing results in vertical fractures in rocks at depths greater than 2000 feet and horizontal fractures in rocks shallower than 2000 feet. EPA was interested to know if fractures can extend out of the rock formation being fractured and into overlying rocks containing groundwater. EPA cites studies showing vertical fractures from hydraulic fracturing operations can extend several thousand feet upward, however fracture length is really dependent on the rock formation being fractured. For example in the Marcellus Shale, most vertical fractures only extend for a few hundred feet. EPA argues the depth of most oil and gas rock formations and their great distances from overlying aquifers prevents movement of fluids and gas along induced fractures into drinking water. Based on the data reviewed by EPA, only 20 % of wells had less than 2000 feet between the shallowest point where fractures could extend upward and the base of the drinking water formation.  This doesn’t mean fractures are not a pathway through which groundwater could be contaminated. It just means it is highly unlikely in most cases. EPA has more concern about this potential pathway for contamination when hydraulic fracturing is either in the same formation as a drinking water resource or a drinking water resource is less than 200 vertical feet from the oil and gas formation, as occurs in several places in Wyoming and California.


EPA examined several studies assessing the likelihood of what happens to hydraulic fracturing fluid which does not come back up a well once a well is depressurized. These fluids are called “leak off” and most studies show they are absorbed onto clays or are inhibited from moving out of the local area of the well by various physical forces in the subsurface. You’ve got to remember, the rocks being fractured lack permeability (the ability of liquid and gas to move through them.) It’s why the rocks are being fractured in the first place. But then again, some studies have shown the “leak off” fluid can displace gases in the pore space, which means until the oil and gas well starts operating and sucking up all the oil and gas in the area there is a period when you might have some movement of the gas into and along the fractures. Most modeling studies show the gas shouldn’t reach overlying drinking water resources without a direct conduit upward like a fault or an abandoned well. And then there are a few conflicting studies, where natural gas from underlying oil and gas formations has been found in shallow aquifers and EPA has been unable to identify a clear subsurface conduit.


So has EPA proved the potential of poorly constructed and damaged wells to transmit gas and fluid to drinking water resources – yes and no. They have certainly shown a few documented cases where contamination has occurred as a result of poor well construction and well failure. EPA has not however provided a good thesis for how frequently contamination along this pathway occurs. Not their fault – there is simply not a lot of available data which EPA could rely on to make such a determination. How about the potential pathway along natural fractures, faults, and abandoned wells? Has EPA proven or disproven the existence of such routes for fluid and gas movement and the degree of impacts groundwater is suffering as a result? Again yes and no – EPA has cited a couple of studies which have shown direct movement of gas up uncemented casing into natural fractures and other subsurface features then into ground and surface water. But then the modeling of such scenarios presented in the EPA report pretty clearly shows that once production starts all gas and liquids should flow into the production well and not be migrating elsewhere.


EPA states “The limited amount of available information hinders our ability to evaluate how frequently drinking water impacts are occurring, the probability that these impacts occur, or to what extent they are tied to specific well construction, operation and maintenance practices. This significantly limits our ability to evaluate the aggregate potential for hydraulic fracturing operations to affect drinking water resources or to identify the potential cause of drinking water contamination in areas where hydraulic fracturing occurs.”

Hydraulic Fracturing Impacts on Drinking Water – Chemical Spills

I have been writing a series of posts over the last month on the final report from the U.S. Environmental Protection Agency (EPA) covering the environmental impacts of hydraulic fracturing of oil and gas wells on drinking water resources. The report is entitled:  “Hydraulic Fracturing for Oil and Gas: Impacts from the Hydraulic Fracturing Water Cycle on Drinking Water Resources in the United States” (EPA-600-R-16-236Fa, December 13, 2016.) Today’s post concerns the potential impacts of chemical spills during the hydraulic fracturing process. This is my fourth post on the report overall and I will admit up front, it’s the worst post I have ever written. Not my fault. Unfortunately, there is just a total lack of quality data in the part of EPA’s report which covers chemical spills at oil and gas well sites being hydraulic fractured.


Hydraulic fracturing is not the only industry where mixing and transferring chemicals and fluids create spills. Spills happen in all sorts of industries and with all sorts of transportation. If you have worked in the environmental field for a while then you know chemical spills are still a problem throughout the United States, even though regulators and companies alike have worked aggressively to prevent them over the last forty odd years. I thought hazardous materials spill responders would all be out of a job by now. Hah, not so. The reason they’re not all collecting unemployment is mostly due to the human element involved in the process of mixing or transferring chemicals – in other words you and I screwing things up.


For their report, the EPA has sought to quantify the number and type of chemicals spilled at well sites which have undergone hydraulic fracturing and to determine the causes of the spills. EPA used data gathered by state governments and industry over a period of six years starting in 2006. EPA sorted through all this data and drew some conclusions.


For example, EPA learned through their data analysis that the combination of chemicals used in hydraulic fracturing is based on local conditions. Local conditions are such things as the type of rock formation being fractured and the type and quantity of fluid with which the chemicals are mixed.  The variability of chemical mixtures from site to site results in there being very little in common nationally in the types of chemicals spilled at oil and gas well sites. The chemical formulation of a fracking fluid in Pennsylvania can be completely different from the fracking fluid formula in West Texas or North Dakota.


The state and industry data also showed human error as the cause of the greatest number of spills at well sites, followed closely by equipment failure (such as hoses transporting chemicals) and failure of  containers storing chemicals. Out of approximately 36,000 spills reported in the state and industry data, EPA identified only 457 that were at or near the actual well site being fractured. Of these 457 spills, 151 were a result of chemical mixing operations at the well site. Of the 151 spills, 54 came from storage containers. Sixteen of the spills were actually caused by holes and cracks in the containers. In fact, storage containers were the number one source of spills which reached a drinking water resource. Storage container failures resulted in the most concentrated chemical spills and the largest volume of chemicals spilled, because the chemicals are generally being stored in a concentrated form. Once the chemicals leave storage and are mixed in tanks with fluids (generally water) for use in hydraulic fracturing then they become diluted and the impact of a spill is not as severe. One of the problems with the state and industry data collected by EPA is that there’s little actual information on the exact chemicals spilled at the well sites. There are just general descriptions, such as: oops we spilled some acid or a biocide. There’s better information on the volume of the spills though. The amount of chemicals spilled as a result of the mixing process ranged from 5 to 19,000 gallons.


Of the 457 spills which occurred at an actual well site, 225 were of produced water. Produced water consists of the natural groundwater in the oil and gas formation plus the remnants of the hydraulic fracturing fluid. Once hydraulic fracturing has taken place and pressure is released at the wellhead on the surface, then produced water comes back up the well bore. Usually it is collected in tanks, but obviously there have been spills. Produced water contains only very dilute amounts of the hydraulic fracturing fluid chemicals.


I know what you are thinking. You saw the big number of 36,000 spills. What the heck are all those spills? Sorry it is a bit of a mystery, because the data used by EPA is so bad. Other than the 457 spills mentioned above, EPA couldn’t determine where approximately 12,000 of the spills occurred. On top of that, 24,000 of the spills weren’t at the oil and gas well sites at all.


Did any of the identified 457 spills at the well sites cause contamination? You bet, 101 of the spills contaminated something, mostly soil (97 of the spills). Thirteen spills reached surface water and 9 of the spills contaminated both soil and surface water. There was no reporting on whether groundwater was contaminated because nobody is monitoring groundwater at hydraulic fracturing well sites.


What does this all mean? I don’t know. It’s the reason I called this post the worst I’ve ever written. The weak data on which the report is based makes it hard to say anything about the state of drinking water contamination caused by surface chemical spills at hydraulic fracturing well sites. Obviously there is a big gap in EPA’s analysis. But you know, it is hard to effectively quantify spills from incomplete and inconsistent data.


Probably the most interesting part of EPA’s report on chemical spills at hydraulic fracturing well sites is their analysis of the potential for chemicals used in hydraulic fracturing to migrate into water. Not all chemicals are equal in their ability to move through soils or water. EPA uses a set of chemical properties (for example the ability of the chemical to volatilize into the air and the ability of a chemical to dissolve in water) to determine if the chemical is one that is going to immediately contaminate a drinking water resource or if the chemical is going to hang around all gummed up in the soil and be a source of long term contamination as it slowly leaches drop by drop into groundwater and surface water. Of course nowadays, most spills that contaminate soils get cleaned up right away, so the second scenario involving long term contamination is unlikely in most cases.


Here’s what I thought was interesting about the chemical migration analysis. EPA states that of the 20 most frequently used chemicals in hydraulic fracturing nationwide, the majority are soluble (meaning they readily dissolve in water). The most soluble and mobile in water are methanol, isopropanol and ethylene glycol. There are a few petroleum based organic chemicals in the top 20 most frequently used chemicals in hydraulic fracturing that are not very soluble. But as EPA points out, there are other chemicals used in hydraulic fracturing fluid, like surfactants or alcohols, which can enhance the mobility of organic chemicals including those that are petroleum based. In other words, alcohol carries the organic chemicals along with it in the water. Fortunately chemicals in the environment are not necessarily forever. They are subject to breakdown by bacteria or by chemical transformation. So a chemical like methanol will eventually break down over a period of time to formaldehyde then to formic acid and finally to carbon dioxide.


Anyway, I’m going to say here, EPA’s report is less than a stellar account of the rate and fate of chemical spills at hydraulic fracturing sites. I suppose if you have bad data, you just have to kind of make do with what you have and at least try to say something about it. After all EPA has taken six years to produce a report to Congress. I guess they didn’t want to have to write in the report that their method of analyzing the scope and impact of chemical spills was a total bust. And I suppose regulators and industry can use the information, no matter how small a data set it is, to direct their attention to prevention efforts. Since most of the spills are from containers, they could concentrate attention on conducting inspections of storage areas. But does the report give a national picture of whether chemicals spilled during the hydraulic fracturing process are affecting drinking water resources? No, I don’t think so.

Selenium Contamination

So many reports assessing environmental conditions erroneously list selenium under the category of heavy metals or toxic metals. Selenium is not a metal at all. On the periodic chart, it is actually located between sulfur and tellurium and is part of what is called the oxygen family. Chemically, selenium acts somewhat similar to sulfur in that it combines with a lot of metals. It is often found in metal sulfide ore deposits (for example at copper and zinc mines), which may be why a lot of environmental scientists and engineers group it in with heavy metals when they are assessing water or soil for environmental contaminants. Selenium has long been known to have environmental impacts on egg laying animals such as fish and birds, but in humans selenium toxicity is rarely seen.


I checked with the bible of references for toxicity: The Agency for Toxic Substance and Disease Registry’s (ATSDR) Toxicological Profile for Selenium. The reference was updated in 2003. The reference gives only a few cases of selenium toxicity, mostly from industrial chemical exposure. But there are two interesting cases in China of selenium toxicity due to long term ingestion of high levels of selenium in food. Crops in these areas of China were planted in soils with very high natural selenium content and as a result selenium became incorporated into the plants biological structure during growth. Common health effects seen by doctors examining the people who lived in these areas were brittle hair and deformed nails. Tooth loss and the loss of feeling and control of arm and legs in some people were also noted. There’s actually a name for the health effects of too much selenium in your diet. It is called selenosis. It’s found not just in humans but in other mammals as well.


The Toxicological Profile also noted health effects due to low selenium in people’s diets. In fact, there is a Recommended Daily Allowance (RDA) for selenium. If you take a one a day vitamin like I do, you can see selenium listed right on the label.

IMG_1476

The RDA is 0.055 milligrams per day. Selenium is a vital trace element for humans and animals, but can be harmful at levels greater than recommended. The ATSDR noted that ingesting 10 to 20 times the normal amount of selenium can result in selenosis. So there’s actually a fair amount of difference between what’s needed and what’s toxic. The average American is getting somewhere between 0.071 and 0.152 milligrams per day depending on where they live and what they are eating. You’d have to be getting 0.55 milligrams a day of selenium over an extended period to have any toxic effects. Unfortunately for birds the difference between the level of selenium essential for daily nutrition and a toxic amount is very small. Bird toxicity is often the main concern when you see high levels of selenium in water and fish. The well known results of selenium poisoning in birds are eggs that don’t hatch and deformed chicks. Both fish and birds pass the selenium they ingest to their eggs. Humans excrete most of the selenium they eat in their food. Excrete is the polite way of saying we pass it out through urine or feces. The ATSDR noted no human reproductive issues from selenium. In fact the RDA for selenium for pregnant and nursing women is actually a tiny bit higher than for other adults.


Selenium is everywhere. It can be found in rocks and soils all over the world at very low levels. However there are certain areas of the earth where the rocks and soils are enriched in selenium. A lot of these rocks formed back during the last days of the dinosaurs in the time period geologists call the Cretaceous. I suppose I shouldn’t say the last days of the dinosaurs, because those last days lasted for eighty million years – but hey dinosaurs were around for quite awhile before then. The Cretaceous was also when plate tectonics sort of arranged the world’s landmass in the shape, if not the position, of the familiar continents we know today. In the Late Cretaceous there were a lot of very shallow inland seas. Much of the midwestern and western parts of the United States were covered with these shallow water bodies and over the millennia they filled with rich marine organic rock and evaporite deposits. Evaporite deposits are rocks like gypsum, salt and phosphate. Organic rich rocks include oil shale and coal. Rocks formed in these shallow marine basins contain higher levels of selenium compared to other rocks. In the Cretaceous these shallow marine basins existed not only in the United States but also around the world. There are younger rocks formed under the same conditions that also have the same high selenium content; notably the phosphate rocks in southeast Idaho.


These rocks are the source of a lot of trouble for the fish and bird populations of the world. The problem was first noticed way back in the 1970’s at a place called Belews Lake in North Carolina. Belews is not a natural lake. It is a man made reservoir that is essentially a cooling basin for a power plant – a coal fired power plant. One of the sources of water to the reservoir was a fly ash settling pond. When you burn coal you get fly ash. It’s what’s left over after the organic content is burned to create electric energy. It looks a lot like the ash you get in the bottom of your grill after barbequing with charcoal, except charcoal is made from wood. Coal is essentially a rock with a lot of organic matter. You have all sorts of elements in coal that are rock like – silica, aluminum, iron, and calcium. You also have arsenic, cadmium, chromium, molybdenum, mercury and the subject of this blog post – selenium. Some of these elements go up the stack of the power plant as air pollutants but the majority is left behind in the fly ash.


There are lots of accounts of what happened at Belews Lake, but in my opinion, William Frankenberger and Richard Engberg did the best review of the incident in the 1998 publication: Environmental Chemistry of Selenium published by Marcel Dekker, Incorporated. According to their report, the water entering the reservoir from the fly ash settling pond contained 150 to 200 micrograms per liter (parts per billion) of selenium. Doesn’t sound like much does it? In fact, in Belews Lake itself the selenium concentrations in the water were on average only 10 micrograms per liter. But when wildlife scientists started looking at why fish populations were disappearing in the lake, they found up to 70 percent of the fish in the lake had reproductive abnormalities and 16 fish species once found in the lake were totally gone. By 1978 only four species of fish were left in the lake and when their tissues were analyzed for selenium, they were found to exceed 100 milligrams per kilogram (parts per million).  Instead of excreting the selenium, the fish were storing the selenium in their bodies and passing it on to their eggs. Were the fish drinking the water? Of course not, the selenium in the water was being taken up by algae and other microorganisms and entering the food chain, which for fish include a lot of insects, worms, and the like who thrive on algae and microorganisms. In upstream reaches of Belews Lake unaffected by the water from the fly ash pond, normal fish communities were found. There the water contained less than 5 micrograms per liter of selenium. Noting the difference, scientists could pretty much conclude selenium is not good for fish. This was such a notable account of poisoning of fish from low selenium concentrations in water that in 1987 the Environmental Protection Agency changed their selenium freshwater criteria for the protection of aquatic from 35 micrograms per liter to 5 micrograms per liter.


The other landmark environmental account of selenium poisoning is that of the Kesterson Reservoir in the San Joaquin Valley of California. People often speak with reverence about the studies conducted there and scientists talk about the Kesterson Syndrome. Messieurs Frankenberger and Engberg also describe the Kesterson studies in the Environmental Chemistry of Selenium. Remember those Cretaceous marine rocks I described earlier? There are a lot of those exposed at the surface in the San Joaquin Valley in California. I think all Americans know the San Joaquin as a fertile agricultural valley in California, but like all agriculture in the dry western states, they water the heck out of it. There is a lot of agricultural drainage as a result and back in the 1970’s the state of California got the idea to build large shallow impoundments to serve as evaporation basins for the drainage, which could also be managed as a wetland in order to benefit wildlife. Sounds like a win/win right? In fact it looked like it was going to work. The ponds at first received all sorts of good quality agricultural water and a large size marsh with thriving wetland plant communities was established. Wildlife populations began to flourish. Then the impoundments started receiving the saline subsurface drainage from the agricultural irrigation. By 1981 all of the flow into the impoundments was this saline drainage and by 1982 scientists started seeing deterioration of the wildlife in the marsh.


When scientists measured the amount of selenium discharging into the marsh from the irrigation drainage, the water averaged 300 micrograms per liter. The many different fish species that once populated the marsh were gone. The only species left were the mosquito fish which is known to tolerate pollution pretty well, but even they were suffering from reproductive abnormalities and unhatched eggs. Mosquito fish had as much as 120 milligrams per kilogram selenium in their body tissue. Eggs of water birds in the marsh were analyzed by scientists and ranged from 4 to 70 milligrams per kilogram selenium, depending on what type of bird egg it was. I think Kesterson is where scientists first recognized that even among birds there were variations in tolerance for selenium. Scientists checked nests for eggs that failed to hatch. In one count of 578 nests, 39 percent of eggs in the nests had one or more eggs that did not hatch. Up to 15 percent of the egg embryos examined had deformities. Now I was going to include a photo from a U.S. Geological Survey report on bird deformities due to selenium, but I know some of my readers are a little sensitive. So I’m just going to provide a link. If you get queasy looking at road kill, do not click on this link:  http://www.nwhc.usgs.gov/publications/field_manual/chapter_44.pdf .

Fortunately drainage to the Kesterson Reservoir was stopped in 1986.


There are dozens more examples of where low levels of selenium have resulted in environmental damage. There has been a lot of research on selenium since the incidence at Belews Lake and in July of 2015, the Environmental Protection Agency issued a draft proposal for further updating the selenium water quality criterion for protection of aquatic life.

Update on EPA’s Science Advisory Board Peer Review of the Draft Report on Impacts of Hydraulic Fracturing on Drinking Water

As regular readers of the Waterblogger know, the Environmental Protection Agency’s (EPA) Science Advisory Board (SAB) is busy finalizing its peer review of the agency’s draft report: “Assessment of the Potential Impacts of Hydraulic Fracturing for Oil and Gas on Drinking Water Resources.”  If you haven’t been reading Waterblogger regularly the original article is below.

Science Advisory Board Peer Review of the EPA’s Draft Report on Impacts of Hydraulic Fracturing on Drinking Water

I’ve been following the SAB’s discussions through the public teleconferences. The first was on February 1, 2016. Consequently a second draft of their 133 page peer review report was issued on February 16, 2016. A second conference call was held on March 7, 2016. These are long conference calls. The March 7 conference call went some seven hours. The first two hours were dedicated to registered speakers. Anybody can be a registered speaker. All you have to do is apply. You get three minutes. Very little scientific work is presented by these speakers. Most speakers are representatives of environmental or industrial trade groups touting their positions. Sometimes there are company reps and consultants who have additional reports or data for submission which help inform the peer review. And then there are a whole lot of very angry and emotional people from areas where oil and gas development has occurred who think they are being poisoned by hydraulic fracturing.


It was nice to see the Science Advisory Board’s respectful questions to the registered speakers and their acknowledgement of people’s concerns about the impacts of hydraulic fracturing on their drinking water. It was less nice to listen to the SAB members parse the words in EPA’s report. Their biggest concern is over the meaning of EPA’s finding: “we did not find evidence that these mechanisms have led to widespread, systemic impacts on drinking water resources in the United States.” The “mechanisms” being referenced are the whole industrial process involved in hydraulic fracturing from storage and mixing of chemicals on-site, to well construction, waste disposal, and the actual injection of hydraulic fracturing fluids which breaks subsurface rock in order to get better flow of oil and gas. An SAB member actually read out loud the definition of the words “systematic” and “widespread” used in EPA’s finding. This sentence in the report has been very controversial and was seized upon by both industry and environmental groups to support an agenda or detract from the validity of the report. So this SAB decided to make it a center of controversy too.


In the SAB’s peer review comments, they asked EPA to support their finding through scientific evidence contained within their report on hydraulic fracturing.  However, there was a dissenting opinion to the peer review comment by one of the SAB members who stated in writing:


“The conclusion by the EPA in the June 2015 draft Assessment report stating “We did not find evidence that hydraulic fracturing mechanisms have led to widespread, systemic impacts on drinking water resources in the United States” is accurate, clear, concise, unambiguous, and supportable with the facts EPA has reviewed.”


I would wholly agree with the dissenter. As the conference call laboriously progressed, it became clear some of the SAB members had also come to the same conclusion. The EPA didn’t say there were no cases of impacts on drinking water from hydraulic fracturing. The EPA just said based on their analysis of available data, impacts on drinking water as a result of hydraulic fracturing were not widespread or a regular occurrence. If you read further in EPA’s report, they state there are localized cases of drinking water contamination after hydrofracturing has occurred in an area. These cases have tended to be in areas where there were spills, poor cementing of casing, or poor waste disposal practices. EPA further states in their report that there are many existing mechanisms which could cause contamination of groundwater during hydraulic fracturing:


“we conclude there are above and below ground mechanisms by which hydraulic fracturing activities have the potential to impact drinking water resources. These mechanisms include water withdrawals in times of, or in areas with, low water availability; spills of hydraulic fracturing fluids and produced water; fracturing directly into underground drinking water resources; below ground migration of liquids and gases; and inadequate treatment and discharge of wastewater.”


I hope the SAB can come to some conclusions and finish their review comments as the result of the call. The EPA process allows for dissenting opinions and they are generally included in Appendixes to an SAB’s review. Further discussions will just continue to delay a final report from EPA on the impact of hydraulic fracturing to drinking water sources.


It is not unusual to have differing views of what conclusions can be reached based on data from scientific research. Generally such differing views are a result of uncertainty in the data or a poor presentation of the research results. The latter case seems to be what is driving this SAB’s elaborate discussions involving the very meaning of words. It’s time for this SAB to wrap it up and send their peer review forward.

Science Advisory Board Peer Review of the EPA’s Draft Report on Impacts of Hydraulic Fracturing on Drinking Water

I was elated when I got the notice that the Environmental Protection Agency’s (EPA) Science Advisory Board had finished the peer review of the agency’s draft report: “Assessment of the Potential Impacts of Hydraulic Fracturing for Oil and Gas on Drinking Water Resources.” I thought at long last there will be a final report issued. My elation turned to dismay after reading the 133 page peer review. Of course EPA asked for it. EPA asked the Science Advisory Board to look at how complete and accurate each chapter in their report was, to determine if information in each chapter supported the conclusions, to evaluate what other conclusions might be drawn from the material presented in a chapter, and to provide additional background, information, and research gaps.


The Science Advisory Board’s comments were comprehensive. So much so that I now think it unlikely we will get a completed report from EPA in a reasonable timeframe. For those of you who are unfamiliar with what a Science Advisory Board is, let me make a short explanation. EPA’s Science Advisory Boards are external review teams made up of senior scientists from universities, corporations, trade groups, state agencies, and consultants. The members of the team are usually some of the foremost experts in their fields. In this case most of the board members are academics. Their comments are very detailed and charge EPA with producing a lot of additional analysis and examination of different data sources. Many of the comments will require EPA to undertake significant new work. It’s difficult to say how long such additional new work might take.


I was so alarmed by the prospect of waiting another five years; I sent comments to be part of the docket. After all, this report was begun sometime in 2010. It is now 2016. Companies are continuing to use hydraulic fracturing techniques but there is still no comprehensive report on what impacts, if any, there might be to drinking water in areas where hydraulic fracturing is taking place. If you have been reading this blog’s posts on EPA’s “retrospective” studies of areas where there have been concerns about groundwater contamination, you know there are substantial indications in a few cases that there has been contamination of groundwater resources from stray gas and hydrofracture chemicals after hydraulic fracturing has taken place. These cases have generally been related to blowouts accompanied by releases of fracturing fluid to the surface, poor cement bonding that allowed natural gas to travel up the gas well, or poor disposal locations and practices for waste. Certainly there should be at least some sort of interim report on status to date if the peer review comments are completely accepted as is.


Read my comments to the Science Advisory Board below.

Comments in Response to Request of EPA’s Science Advisory Board on the Peer Review of EPA’s Draft “Assessment of the Potential Impacts of Hydraulic Fracturing for Oil and Gas on Drinking Water Resources” (May 2015, External Review Draft, EPA/600/R-15/047


Thank you for your service on the Science Advisory Board (SAB) Hydraulic Fracturing Research Advisory Panel. I have three comments I would like to share with the Science Advisory Board in regard to comments made by the SAB on the EPA’s Draft “Assessment of the Potential Impacts of Hydraulic Fracturing for Oil and Gas on Drinking Water Resources.” The first two are of a technical nature and the second is in regard to the overall extent of comments and length of time which may be needed for EPA to address all SAB comments.


(1) My first comment is in regard to the SAB’s review of Chapter 4 of the EPA report covering “Water Acquisition.” I will paraphrase the SAB comment: water acquisition is a localized issue as to its impacts on groundwater and surface water resources. The SAB comments also state there are important gaps and uncertainties in publicly available information on sources and quantities of water used in hydraulic fracturing. The SAB goes on to recommend that EPA examine well completion reports, permit applications and water management plans to assess water usage for hydraulic fracturing. I have followed the water acquisition issue for many years and it seems to be of greatest concern to western state water managers. Most of these water managers are responsible for allocation of water resources within their states. Many may have a compilation of water usage data within the state engineer’s office and because of past expressed concerns may have collected data on water usage for hydraulic fracturing. An assessment of well completion reports and permit applications sounds like an extensive effort and since indeed water acquisition impacts are localized a reconnaissance for state data sources would be more expedient.


(2) My second comment is in regard to the SAB’s review of Chapter 6 of the draft EPA report. Page 54 states: “Modeling results do not represent actual sites or all combinations of stresses, gradients, rock properties, typical geology and heterogeneity. Include a discussion on the importance of understanding regional geology of an area prior to embarking on installing a hydraulic fracturing well.” I was disappointed, after reading the EPA’s draft report, in the lack of incorporation of information from the retrospective case studies. One of the main points I took away from the retrospective studies was the lack of characterization of the local geology, hydrogeology and water quality prior to hydraulic fracturing. In their retrospective studies, EPA was in some cases relying on water quality data from the 1970s. It seemed obvious from the retrospective case studies that any contamination of drinking water resources, whether from degraded hydraulic fracturing chemicals or stray natural gas and whether from a blow-out or from poorly constructed wells (or even from natural conditions), is dependent on local geology and hydrologic conditions such as hydraulic gradient, fracture flow, etc. An assessment of these local characteristics could inform what protective construction needs are in advance of drilling a well or disposing of waste. It would also inform response to large spills by defining depth to groundwater, hydraulic gradients, and migration pathways for contaminated groundwater.  The SAB should make this a stronger recommendation to EPA. I recall one of the goals, EPA set out in producing their report, was to provide information to help regulators. Site and local characterization of the geology and hydrogeology before hydraulic fracturing could be incorporated into the regulatory permit process in areas where it is not now required.


(3) My final comment is in regard to the scope of the SAB comments. The SAB has produced a very comprehensive and well informed set of comments. However I would urge you to look at the necessity of some of the data needs you are recommending to EPA for inclusion in the current report. Some of the recommendations could take extensive extra effort. We are already five years from the inception of EPA’s report. In fact, many of your recommendations are to update information in the report. Just updating information to 2016 could take significant efforts. I am worried about the extended time period for EPA to produce a report. Could the efforts take so long that once again in two years we are asking EPA to update the report with new information. I’m afraid it could be a never ending cycle. I think the SAB and the EPA need to assess the time needs for each one of the comments to be incorporated into the report and determine if the information need is vital to the current report or could be included in a follow-on report.         


Thank you for the opportunity to comment.

New Assessment of EPA’s Draft Report on Impacts of Hydraulic Fracturing to Drinking Water

Finally EPA’s Science Advisory Board has issued an assessment of the agency’s draft report: “Assessment of the Potential Impacts of Hydraulic Fracturing for Oil and Gas on Drinking Water Resources.” This is the Science Advisory Board’s peer review of the June 2015 report written by EPA’s Office of Research and Development. The EPA report on impacts of hydraulic fracturing on drinking water has been undergoing public review and comment as well as the Science Advisory Board review. So here we are six months later and EPA’s Science Advisory Board is going to hold a Public Teleconference on February 1, 2016 to discuss their assessment of the draft report. Comments are due on the Science Advisory Board’s assessment by January 21, 2016. There are already 300 comments just on their assessment. Most of which read like: “Hey you fatheads at EPA, we really don’t like hydraulic fracturing and we don’t care that your report says hydraulic fracturing hasn’t caused widespread contamination of drinking water – just stop it.” It looks like the Science Advisory Board’s report is only a small one, just 133 pages. At least we are coming somewhere near a conclusion (I hope) on the final report.  I’ll scope out the Science Advisory Board’s report and teleconference and let you know what the next steps are to finalizing EPA’s Assessment Report.