All posts by Waterblogger

The author has 35 years of environmental experience primarily with oil and gas and mining development, abandoned mines, and water issues in the private and public sector. A colleague once described the author as being a member of every weird water group in the West. A former Department of the Interior employee, the author received the Department's highest award for Distinguished Service in 2015.

Environmental Protection Agency Announces Clean Water Act Rule

The Environmental Protection Agency announced May 27, 2015 the final Rule to clarify the definition of waters protected under the Clean Water Act. Predictably a News Release was issued entitled “Clean Water Rule Protects Streams and Wetlands Critical to Public Health, Communities, and Economy.” If you didn’t know what the Rule was about in advance then you certainly wouldn’t be able to discern it from the Press Release. Having followed the issue for many years, I will offer a short explanation of what this Rule is and why it was issued. In future posts I will write about the science used in making the Rule.

Let’s start with the Clean Water Act. It was written in 1972, over forty years ago now. But just like today, the legislation was written by Congress. Congress often writes very vague legislation from which the federal agencies are then tasked with developing regulations. Agencies have to interpret Congress’s meaning and intent. Sometimes the federal agency writes regulations that don’t exactly meet the wording of the legislation. When the Agency goes to enforce the regulation they then get sued by the person or company being enforced upon. More or less that is why the Clean Water Rule was written.

The Clean Water Act makes it unlawful to discharge dredged or fill material into “navigable waters” of the United States, tributaries of such waters and adjacent wetlands without a permit. There are regulations that the cognoscenti in the environmental world call the 404(d) regulations. The 404(d) regulations require permits for discharge of dredge and fill material. The regulations expanded upon what was written in the Clean Water Act by  including interstate wetlands, lakes, rivers, streams (including intermittent streams), mudflats, sandflats, wetlands, sloughs, prairie potholes, wet meadows, playa lakes, natural ponds, tributaries of such waters and adjacent wetlands. That covers a lot of territory. The agency responsible for issuing 404(d) permits is not the Environmental Protection Agency. It is the United States Army Corps of Engineers. Go figure. Anyway they have offices all over the United States just like all the other federal agencies and these individual offices have to interpret what the regulations mean when they are reviewing a permit or looking at a potential violation.

In Michigan in 1989, some wetlands on private land were filled by a developer. The wetlands were near ditches that eventually emptied into navigable waters. The Corps of Engineers said it was a violation of 404(d) regulations and fined the developer. The serious thing about the Clean Water Act though is that it has criminal violations as well as civil penalties. So you can get into a lot of trouble with not getting a federal permit.  The developer sued. The lower courts ruled in favor of the Corps of Engineers. The developer appealed to the Supreme Court. The case is called Rapanos versus the United States. It was argued in front of the Supreme Court on February 21, 2006 and a decision was issued on June 19, 2006. The arguments and decision included another case called the Carabell case where a permit to deposit fill in a wetland separated from a drainage ditch by an impermeable berm was denied.

Anyway the Supreme Court decision was to send the cases back to the lower courts because they had applied the wrong standard to determine if wetlands are covered as “waters of the U.S.” and also because there was a lack of record by the lower court in their decision. The decision contained an opinion by Justice Scalia which was the most scathing Supreme Court opinion I have ever read. There were probably two reasons behind the tone of the opinion. First the Clean Water Act forthrightly states that the State governments have primary responsibility and right to plan the development and use of land and water resources and it is not the Clean Water Acts intent to change that responsibility. Management of land use and water resources is a jealously guarded privilege of State governments and these two cases as well as others seemed to be getting into a federal management of private land use and water. The second reason is because the Supreme Court had heard a similar petition back in 2001 called the SWANNC case, which is the Solid Waste Agency of Northern Cook County versus the Army Corps of Engineers. I won’t bore you with the particulars of the case but the Supreme Court’s decision said the scope of the Corp of Engineer’s regulations was inconsistent with the Clean Water Act. So you can see why Justice Scalia might be a little testy. After the SWANNC case decision, the Corps of Engineers and the Environmental Protection Agency did initiate a rule making but it went nowhere. I don’t have the inside scoop on why.

So some years after the 2006 decision by the Supreme Court, the rule making initiative started up again. The first time I heard about the new rule making initiative was in 2009 at a meeting of a large gathering of state water officials. A poor guy from the Environmental Protection Agency came to the meeting and presented the agency’s plans in regard to writing the Clean Water Rule. There was nearly a riot. Well maybe I’m exaggerating a little, but he was told that the Environmental Protection Agency didn’t need to be addressing water issues that were clearly the state’s purview. There has been constant concern from state governments about federal regulation intruding into state water management. There have been concerns about the extent of coverage by the Clean Water Rule from farmers, natural resource developers, property developers…literally anyone who has large land holdings.

The Clean Water Rule is therefore written to say as much about what it doesn’t apply to as to what it does apply to. The Rule is nine pages. Two pages tell you what is covered under the meaning of “Waters of the United States.” and two pages tell you what isn’t covered under the meaning. The rest of the Rule is definitions of terms used in the other four pages. This is a carefully crafted and wordsmithed Rule.

Here is a link (http://www2.epa.gov/cleanwaterrule/clean-water-rule-factsheets) to an Environmental Protection Agency Fact Sheet that tells you what is covered in the new Clean Water Rule.
The U.S. Environmental Protection Agency Announces the Release of the “Draft Assessment of the Potential Impacts of Hydraulic Fracturing for Oil and Gas on Drinking Water Resources”

The Environmental Protection Agency finally released their “Draft Assessment of the Potential Impacts of Hydraulic Fracturing for Oil and Gas on Drinking Water Resources” last Thursday June 4, 2015. They held two webinars on Friday about the contents of the report. If you’ve been reading this blog for a while, you knew that the report was due for release, you’ve also gotten the background on what the Environmental Protection Agency has been studying and why. If you are a new reader of this blog, go back and check out previous posts. The posts will give you information on the studies the Environmental Protection Agency has been conducting.

I was excited to see the report come out even though it is 998 pages and I am committed to reading the whole thing. In addition, the Environmental Protection Agency published a bunch of new scientific papers on hydrofracturing. So I will be reading up for a while on all this new scientific information. I will be posting about the contents of the report so you can get the in-depth information without having to read the whole 998 pages yourself. The Environmental Protection Agency will be accepting comments until August 28, 2015.

The Environmental Protection Agency said that their studies found no widespread contamination of drinking water resources by hydraulic fracturing. That is a pretty strong statement. However, The Environmental Protection Agency also stated their studies have identified vulnerabilities that need to be addressed by state regulators when permitting hydraulic fracturing wells. So it was a good news, bad news sort of message. Look for future posts on this blog about the report results.


Global Man-made Mercury Contributions to the Atmosphere

I had a conversation the other day with a friend of mine who is an environmental attorney. I was telling her about the Environmental Protection Agency’s regulations to reduce mercury emissions from coal burning power plants. Her area of legal expertise is not air regulation so it was news to her that the Environmental Protection Agency had written and issued the regulations. Actually her area of expertise is international environmental law. She asked me a very logical question coming from someone who has a global perspective. What portion of global emissions is coming from the U.S. compared to countries like China who burn lots more coal than the U.S. and who have about zilch in the way of emission controls. I said mercury emissions from the U.S. are pretty small in comparison to the industrializing countries like China and on top of that the largest mercury air emissions are actually coming from small gold mining operations in Africa and South America. Yes, can you believe it? It is the 21st century and yet these mostly unregulated and often illegal mining operations are still using mercury to produce gold.

Go back to my previous blog post on “Where is All This Mercury Coming From?” and take a look at the chart showing mercury emissions over the last couple of hundred years. You will notice a big old slug of mercury air emissions between the years of 1850 to 1884. Those were the years of the Gold Rush. If you are an American, you will probably have studied the Gold Rush in school. The famous location where it all started was Sutter’s Mill on the South Fork of the American River in Coloma, California. James Marshall’s discovery of gold in the South Fork at Sutter’s Mill in 1848 is an iconic event in American History and Sutter’s Mill is now a California State Park. The event set off gold fever in the U.S. and thousands of people migrated west to try their luck at getting rich by mining gold. History books even have a name for these migrants – the 49ers. Yes, San Francisco named their football team after a bunch of gold miners.

As we have seen, mercury is a unique metal with some highly unusual properties. One of these properties is that it binds readily with other metals in what is called an amalgam. The 49ers learned pretty quickly that mercury was the perfect way to extract gold from the river sediments and the rock and soils they washed out of the Sierra hillsides through hydraulic mining. They washed the gold through mercury lined sluices and over mercury coated metal plates the size of houses. Mercury from these gold extraction processes can still be found today in the American River. Fortunately the use of mercury in gold extraction was replaced by another toxic favorite – cyanide. Cyanide has its problems but at least it degrades rapidly. Mercury is forever.

I took a look at the United Nations Environment Programme report “Global Mercury Assessment 2013: Sources, Emissions, Releases and Environmental Transport.” According to the report, small gold mining operations are now the largest source of man-made mercury emissions. The U.N. has calculated contributions from world-wide mercury sources to annual mercury emissions. The numbers in the report are from 2010. In 2010 global estimates were 1960 tons of mercury released into the air. Seven hundred and twenty seven tons of the mercury came from small gold mining operations. That is 37 percent of all mercury emissions. Worldwide in 2010 only 475 tons of mercury came from burning coal in power plants. Sure that is a big figure too. Twenty four percent of all annual emissions in 2010 came from power plants. It is the second biggest source.

Here’s the answer to my friend the environmental attorney. The whole of North America (remember Canada and Mexico are included in with the U.S.) only contributed 60.7 tons or 3.1 percent of mercury to the global atmosphere. That is from all sources, not just power plants. Even the European Union contributed more mercury to the atmosphere (4.5 percent). What about China. There were not specific numbers for China in the U.N. report, but Asia contributed nearly 50 percent of the global mercury emissions. East and Southeast Asia were 40 percent and South Asia was 8 percent.

Mercury in Coal

I got an email from a reader. They wanted to know why coal has so much mercury in it. In reality coal doesn’t have that much mercury in it. The problem is that you are burning the coal and releasing the mercury into the atmosphere.

Interestingly enough, the smarty-pants at the U.S. Geological Survey have been analyzing coal for years. They have an entire database of coal samples from all over the country. Admittedly, it is somewhat skewed to samples of coal from the eastern United States, but it is the best collection out there.

Mercury is one of the elements for which the Geological Survey has been analyzing the coal samples. Their database includes about 7000 samples of coal. The ranges for mercury in coal are from .003 parts per million to 1.753 parts per million. Eighty percent of coal samples are less than .25 parts per million. The mean coal content is .17 parts per million. (Remember mean is the average – all the mercury values for samples in the database are added up and divided by the number of samples.) Parts per million are milligrams per kilogram. These are very tiny numbers. And that is not even the coal that is going to the power plants. A lot of coal is “cleaned” before it goes to the power plant. Utilities want a good burning coal without a lot of ash and sulfur, so after coal is mined it is often sent through a cleaning process to reduce these unwanted attributes. Ash and sulfur are unwanted because the United States Environmental Protection Agency has regulations to reduce particulates (ash) and sulfur. You don’t want to breathe particulates because they are linked to respiratory problems and you don’t want to have sulfur in the atmosphere. Remember acid rain? Yes sulfur is the big contributor to that problem. The Geological Survey says that 37 percent of mercury is removed by coal cleaning.

When the Environmental Protection Agency wrote their regulations on reducing mercury at power plants, they didn’t rely on the Geological Survey’s database. They conducted a study back in 2010 on mercury content of coals delivered to power plants. I didn’t go looking for this study. The Geological Survey says that the Environmental Protection Agency’s mean mercury content for coal delivered to power plants is .12 parts per million. A bit less than the .17 parts per million the Geological Survey had for their database. The Geological Survey attributed the difference primarily to coal washing and the fact their database had more eastern coal which is higher in mercury than many western coals. Interestingly, the Geological Survey analysis of their database showed Northern Appalachian and Southern Appalachian eastern coals to have the highest mercury content of U.S. coals.

The Geological Survey is doing a lot of research on where mercury resides in coal. I personally thought this was interesting because it was something new to me, so I wanted to share it with you. Pyrite is the source of most of the mercury in coal. You may know pyrite by the term fool’s gold. It is an iron sulfide and often has trace metals like mercury associated with it. Mercury in coal can also be bound to the organic carbon in coal, it can be sort of diffuse as elemental mercury, and it can be part of other minerals found in coal.

Here’s another interesting fact from the Geological Survey. Their database also includes about 1600 coal samples from 57 other countries around the world including China. They looked at the mean mercury content of those samples and found it was 0.16 parts per million, about the same as the mean mercury content of coals in the United States.

Anyway I digress from the main point of my post here which is coal is not teeming with mercury, in fact not any more so than say soils. The same Geological Survey has analyzed soils from all over the country. One of the elements they have analyzed for is mercury. They looked at three different depths of soil. Just looking at the top 5 centimeters of soil, mercury levels ranged from non detectable by current analytic methods to 3.55 parts per million. Soils in the middle part of the U.S. were lower than the soils on the east and west coasts. Again these are really tiny numbers. But we don’t burn soil.

What is EPA Testing Water Wells for in their Case Studies?

This post is part of a series on EPA’s Hydraulic Fracturing Study. Previous posts will give you more detail on the specific case studies EPA is conducting and you may want to read them prior to reading this post.

EPA is running a number of standard water quality tests as part of their water well sampling for their case studies. These tests characterize the water. Standard measures for water are things like temperature, pH, Total Dissolved Solids (you’ll see this referred to as TDS), specific conductivity, alkalinity, turbidity, dissolved oxygen, oxidation/reduction potential, ferrous iron, and hydrogen sulfide.  EPA will also be looking at existing water quality data collected for the case study areas by government agencies whose business is to characterize water resources. Your average person only generally knows they have hard water, or too much lime that leaves a ring in their bathtub, or their water smells like rotten eggs. They don’t know if they have a bicarbonate or alkaline water, or low dissolved oxygen, or hydrogen sulfide. But your water scientist will. These are water characteristics that they use to describe water. Get one of these water scientists at a dinner party and they will be telling you how your favorite European mineral water gets its taste. EPA’s water scientists will look for changes in water quality characteristics or unusual test data and deduce if something may be going on in the well they are testing.

EPA is testing a large number of chemicals that hopefully aren’t characteristic of your average drinking water. These are mostly chemicals associated with the components of hydrofracturing fluid. Hydrofracturing fluid is generally over 98 percent water but the remaining 2 percent is composed of additives that help the engineer get the oil and gas out of the rock and into the oil and gas well. The additives EPA is testing for are chemicals such as glycols, acids, surfactants, volatile and semi-volatile organic compounds. Volatile organics are things like toluene and styrene. Semi-volatile organics are things like 1,2,4-trichlorobenzene. These are not good to drink.

There are also natural substances commonly found in the flowback water that are removed from the rock during the fracturing process. Some of these are being tested for as well. These are arsenic, manganese and iron. And EPA is testing for chloride and bromide which are characteristic of the flowback water as well. If you have been reading this series of posts on hydrofracturing you will remember that EPA has concerns about adequate treatment of chloride and bromide from flowback water at Publically Owned Treatment Works. Natural organic material is also being tested. And EPA is testing for methane, ethane, and propane which are all components of natural gas.

Finally EPA is testing for: stable isotopes of the components of water, which we know are hydrogen and oxygen; stable isotopes of hydrogen and carbon, which you may not know are the components of methane; and strontium. The easiest explanation of why EPA is analyzing for them is because stable isotopes have different ratios depending on how they were produced and where they came from.

This is kind of an aside, but did you know certain companies who require their products to contain a specific proprietary ingredient that only they make often check stable isotopic ratios of their product manufactured by contractor entities? Why? To see if the contractors are using the proprietary ingredients! They can tell by the stable isotopic ratio.

In EPA’s case they are looking at what the usual stable isotopic ratios are for water, methane and strontium in the case study area. If EPA’s well samples in the case study area then show differences from what the normal isotopic ratios are, it is an indication something might have been introduced. In other words it is an indicator of contamination.

Oh wait I forgot, EPA is also testing for NORM. Remember that from an earlier post? It is the naturally occurring radioactive material.

All in all this is a lot of testing and it will be done at several EPA laboratories.  EPA should have a very good picture of whether water in people’s wells has been contaminated and it should help them draw some conclusions on potential sources of the contamination.


EPA looks at Five Areas with Complaints of Groundwater Contamination from Hydrofracturing

We’re still waiting on EPA’s Hydrofracturing Study Report. While we are waiting I’ll go over some of the studies EPA is conducting according to their Study Plan and 2012 Hydraulic Fracturing Study Progress Report. In my last post on hydrofracturing, I discussed two types of case studies that EPA contemplated conducting.  The only case studies which we will probably see in their upcoming Hydrofracturing Study Report are what EPA is calling the “retrospective” studies.

EPA’s “retrospective” studies are case studies of hydrofractured areas that have complaints of groundwater contamination. EPA’s five case studies are from some of the largest oil and gas shale developments. Who hasn’t heard of the Bakken shale in North Dakota by now or the Marcellus shale in Pennsylvania? These are the big new developments in oil and gas that are helping to reduce the price per barrel of oil and producing the cheap natural gas we see on the east coast. It can’t be but five years ago I was reading in the paper about peak oil – the idea that the oil industry was reaching the peak of oil production and would soon run out of sources for hydrocarbon production. Then voila an existing technology – hydrofracture is modified to be used in conjunction with horizontal drilling to shatter shale and free up the gas and oil within. And suddenly everything is changed. Peak oil is dead. At least for the next fifty years or so I would think.

EPA is conducting case studies of the Bakken Shale in Dunn County, North Dakota where a blowout in 2010 resulted in an uncontrolled release of hydraulic fracturing fluid and water from the formation. Water from the formation is simply water already existing within the rock containing the oil and gas. They are often brines and exist most everywhere there is oil and gas. Some people also call them produced waters. The formation water comes up along with the oil and gas. It then has to be separated from the oil and gas and disposed of.

EPA is conducting two case studies in the Marcellus Shale in Pennsylvania: one in Bradford County, Pennsylvania and the other in Washington County, Pennsylvania. For those of you with some historical knowledge, you’ll remember the first oil well in the United States was drilled in the 1850’s in Titusville, Pennsylvania in Crawford County. Washington County is south of there and Bradford County is way east of there. There are plenty of other counties in Pennsylvania where the Marcellus Shale is being developed for gas production but the two case studies EPA chose were based on homeowner complaints about changes in the water quality from their household wells after hydrofracturing of gas wells.

There is also a case study in the Barnett Shale in Wise County, Texas. The Barnett is Texas’s big new oil and gas play. I don’t know much about the Barnett Shale but it is in central Texas. Texas as we know is a huge historic and current producer of oil and gas. I briefly lived in the Fort Worth area when I was young and what I remember about it was the aromatic smell of the oil pumps that were as common as dog walkers are in my current neighborhood. You’d think people would be used to oil and gas development in Texas, but interestingly enough the National Science Foundation did a series of seminars on hydrofracturing a few years back and I got to listen to a lot of people from Texas complaining about oil development in their suburban neighborhoods and to local government officials in Dallas and Ft. Worth who are having to address the increased traffic and noise from drilling and development. Ever heard a compressor pumping oil? It can be really loud.

The other study is of a coal bed methane project in Las Animas and Huerfano Counties, Colorado. I’m not really interested in coal bed methane so I’m not going to write about that study.

If we don’t get a release soon on the EPA Study Report, I’ll do a few more posts in the next few weeks with more details of the four case studies that involve shale oil and gas.

Man-made Emission Sources of Mercury

So why am I writing about mercury? Other than I have a particular interest in it? Well right now the Supreme Court (oral arguments were held March 25, 2015) is looking at a case where the Environmental Protection Agency (EPA) wrote regulations to reduce mercury emissions from power plants and the regulations are being challenged by industry groups. Mercury is coming from power plants? Really?

Yes, really. EPA and industry have done a great job over the last 20 years or so at getting the mercury out. Industrial processes have been changed. Industry has eliminated mercury use in paint and pesticides and reduced its use in batteries. And when was the last time you saw one of those glass thermometers with mercury in it? There is a whole generation now who probably has never seen one. Emissions from municipal waste incinerators, medical waste incinerators, hazardous waste incinerators have all been regulated.

EPA was required under the Clean Air Act amendments in 1990 to study mercury emissions from electric utility generation, municipal waste incineration and other sources. They sent a Report to Congress in 1998 that identified electric utilities as the largest remaining source of mercury emissions to the air.

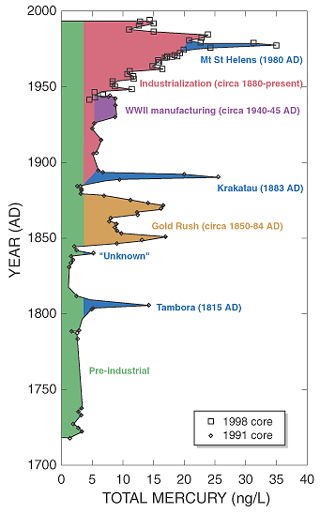
I saw this chart probably about six or seven years ago. It really brought home to me how much mercury there is in the environment now compared to a couple of hundred years ago.

From the USGS Fact Sheet Glacial Ie Cores Reveal a Record of Natural and Anthropogenic Atmospheric Deposition for last 270 Years, FS-051-02, June 2002.
Source: USGS Fact Sheet, Glacial Ice Cores Reveal a Record of Natural and Anthropogenic Atmospheric Deposition for last 270 Years, FS-051-02, June 2002.

The chart is from the U.S. Geological Survey, where collectively in my estimation some of the brightest people on the planet work. The Geological Survey took an ice core from the Fremont Glacier in Wyoming’s Wind River Range. They chose the Fremont Glacier because it was not near an industrial source of mercury and it was in the lower continental United States. Mercury in the air comes down in the rain and in its frozen cousin – snow. So if you drill out a core of ice from a glacier that has accumulated over thousands of years and look at it from top to bottom, you are looking at a record of the amount of mercury there was in snow over time. The Geological Survey didn’t have to analyze for mercury from thousands of years ago, they just had to look back a few hundred years to the 1700’s. As you can see for yourself, other than a big volcanic event (volcanoes eject all sorts of ash and gases into the air including mercury) prior to 1850 there was a lot less mercury in the environment than there is today. The Geological Survey says mercury levels are 20 times higher today than they were in pre-industrial times. You can see that after 1950 mercury levels really hit their highest point. But wait a minute, it looks like about 20 or so years ago mercury levels starting falling again. That is when EPA and industry starting getting the mercury out.

Now these mercury levels the Geological Survey measured are really, really small amounts, basically they are reporting in nanograms per liter. That is one part per trillion. Think of how small that is. That is like a one dollar bill in a stack of a trillion dollar bills. But remember that in animals, methylmercury bioaccumulates. [I wish dollar bills naturally accumulated too, but unfortunately they don’t.] So a small amount of mercury converted to methylmercury can be a big problem.

The primary type of fuel in the power plants that EPA wants to regulate for mercury emissions is coal. When the Report to Congress came out way back in 1998, EPA gave an estimate of the cost of installing technology to remove mercury emissions at coal burning power plants as 5 billion dollars. Yes billion. Here we are 17 years later. Can you imagine what the figure on installing the technology is now?  I don’t even want to look.

EPA’s Report to Congress estimated the yearly releases of mercury in the United States from all sources as 158 tons. They further estimated that 87 % of these mercury emissions were from combustion sources. Coal fired power plants were 33 % of the 87 %. Municipal waste incinerators, commercial and industrial boilers and medical waste incinerators were the other contributors. Remember municipal waste and medical waste incinerators are now regulated.

But here is another twist in the mercury emission story. Air emissions are global. What that means is the United States is just one country contributing mercury emissions to the atmosphere. Many other countries are contributing through releases from power plants, incinerators and lots of other sources. How much of the mercury from U.S. emissions actually ends up in our waterways and soils? EPA sort of has an answer to that question. They used a model to get the answer. For the model, EPA excluded emissions from Hawaii and Alaska. They used a time period of one year for the model. Of about 142 tons of mercury released into the atmosphere from man made emission sources in the lower 48 states, about 48 tons ended up in the local area surrounding the source. About a half a ton remained in the atmosphere after one year. And approximately 94 tons became part of the global mercury emissions. In other words it was transported elsewhere and ended up in somebody else’s soil or water away from the source. It could have ended up in Timbuktu or maybe the Fremont Glacier in Wyoming.

If you want to read more about the Geological Surveys ice core work at the Fremont Glacier here’s a link: http://toxics.usgs.gov/pubs/FS-051-02/

Sleuthing with the Environmental Protection Agency


While we’re waiting for the Environmental Protection Agency to issue their report on hydraulic fracturing, I thought I’d write some more detailed posts on how the Agency is approaching their overall study to determine whether there are impacts to drinking water. I read through their work plan again and their 2012 progress report on their research.

In many ways science reminds me of a good who done it. You take a lot of facts, put them together, form a theory, and then track down all your leads to see if your theory is right. But instead of sending the butler to jail, you publish your work in a peer reviewed journal. So how do you prove or disprove that hydrofracturing is resulting in contaminated water wells. Well one way is to look at areas where there have been complaints of water well contamination and try to look at all possible avenues and sources for the contamination. Forensics can include sampling of domestic and commercial water wells to analyze for additives found in fracturing fluid, assessing oil and gas production wells in the area to see if cementing and other groundwater protections are intact and working as engineered, examining whether there are faults, fractures and abandoned oil and gas wells in the area through which fluids might have traveled, and identifying potential other sources for contamination like agriculture or water well treatments. Based on that information you form a site conceptual model and apply numerical models to determine the likelihood of your concepts.

Another way to prove or disprove whether hydrofracturing is resulting in contaminated wells is to look at an area where a new well is going to be hydrofractured. You characterize the area by taking samples from newly installed monitoring wells and domestic water wells before the fracturing process take place. You examine the processes involved in constructing the well pad. You examine the data from the well logs to make sure the cement is all properly set. You examine how the well performs during the fracturing process. And you examine the well after the fracturing process. Then you go back and sample all the monitoring wells and water wells you previously sampled. And you continue to sample those wells over time.

EPA is doing both of these methods. They are busy with five areas that have current complaints of water well contamination. They are also examining and working with some oil and gas companies to find some sites that might be eligible for study before and after hydrofracturing occurs. EPA originally had two of these types of sites selected but it looks like coordination of the studies has been difficult because of scheduling conflicts. EPA is well underway studying the five areas with complaints of contamination. EPA is calling them “retrospective” studies. But EPA is behind on studying sites that have not been hydrofractured yet. These sites are being called “prospective” studies.  EPA anticipates data from prospective studies will be published much later than their other findings.  So we probably won’t see that information in EPA’s upcoming 2015 report.

Effects of MethylMercury

I vaguely recalled the story of Minamata Bay in Japan. It is a classic environmental disaster story. And it involves methylmercury. Much of the data in regard to methylmercury impacts comes from that unfortunate event. I refreshed my memory by going back and looking at the Agency for Toxic Substances and Disease Registry’s documentation of health effects of mercury.

Industrial mercury waste was disposed of in the Minamata Bay during the 1950s and 60s. It formed methylmercury in the bay and was ingested by fish which were then eaten by people in the area. Over a hundred people there died from methylmercury poisoning and just as tragically women exposed to methylmercury during pregnancy gave birth to children with neurologic disorders. In fact methylmercury poisoning has been given the name Minamata disease.

Methylmercury bioaccumulates. What this means in a simple fashion is that methylmercury accumulates in animal tissue. It is not readily expelled from the body of an organism like a fish or a human. It all starts at the bottom of the food chain with organisms that feed in the sediments of a water body where methylmercury forms and accumulates. Those organisms are then eaten by small fish, which are in turn eaten by larger fish, which are then caught and eaten by people.

There were a couple of cases of methylmercury poisoning after Minamata, but Minamata is really when there became widespread concern about methylmercury in the environment and especially in fish. Everyone has probably heard pregnant women should limit their consumption of some types of fish because of the mercury levels in them.

There has been a good bit of research on low level methylmercury exposure. The studies have concentrated on populations that eat a lot of fish. Many of these groups of people live on islands. The studies focus on children. In the cases of Minamata and other methylmercury poisonings, children born to women exposed to methylmercury were sometimes blind, deaf, paralyzed or had impaired mental development. Researchers were looking into whether there is developmental impairment to children born from women who have diets that include a lot of fish. All sorts of tests exist to see if children are developing in a normal manner and the researchers used these. They analyzed the mother’s hair for mercury. Then they tested the children.

I’m no toxicologist so I referred to the National Academy of Sciences report in 2000 (National Research Council Committee of the Toxicological Effects of Methylmercury), on what they thought about the research. In one study, when mothers had higher mercury in their hair (13 – 15 parts per million), there was a link to lower scores on IQ and other tests of mental functions in their children. The other studies seemed a mixed bag to me, but the National Academy of Science report concluded that several of the studies conducted by researchers showed increases of abnormal findings on standardized neurological exams.

There were also animal studies cited in the National Academy of Science report. They found similar effects on neurological development in animals as there are in humans when exposed to methylmercury.  Monkey and mice studies showed Minamata disease symptoms at pretty low daily doses.

I don’t mean to scare anyone about methylmercury in fish. The FDA has an advisory for mothers and young children. They recommend not eating swordfish, tilefish, king mackerel or shark. Shark? Who eats shark? Must be someone. Anyway the FDA says two average meals of fish a week are fine (about 12 ounces) of fish low in mercury like shrimp, light canned tuna, salmon, pollock, and catfish. Here’s a link to FDA’s Mercury Levels in Fish and Shellfish (http://www.fda.gov/food/foodborneillnesscontaminants/metals/ucm115644.htm).

EPA’s Webinar on FracFocus Disclosure Information

I finally had a chance to listen to EPA’s webinar on their report “Analysis of Hydraulic Fracturing Fluid Data from the FracFocus Chemical Disclosure Registry 1.0”. If you read my April 6, 2015 post on the report, than you can skip the hour long webinar which is located at (http://www2.epa.gov/hfstudy/epa-analysis-fracfocus-10-data-webinar-presentation) because there’s not much information in the webinar other than what I already covered in my post. However, EPA did give a timeframe for when we can expect their final assessment report of hydraulic fracturing. EPA didn’t give a precise date but said it would be issued later in the Spring of 2015.