Tag Archives: mercury

mercury as a contaminant in water

Environmental Protection Agency’s Supplemental Finding on the Mercury and Air Toxics Standards Regulations

People ask me why I write so much about air, when my blog is about water. It certainly might be easier if our world was a more compartmentalized system, where no interactions occurred between air and water. Unfortunately our world is a complex place where air and water interact with each other and the terrestrial environment to bedevil such human endeavors as burning coal in power plants to produce energy. I’ve been writing about mercury in the environment for awhile now. One of the concerns with burning coal is the release of mercury into the atmosphere. Some of the mercury stays in the air and some of it falls into our water and soils when it rains. It’s a complex process and you can read about it in my blog post below.

The Mercury Cycle

The Environmental Protection Agency (EPA) wrote regulations to reduce mercury and other air toxins (such as selenium, nickel, cadmium, arsenic and chromium), from coal and oil fired electric utility generation. The rules are named the Mercury and Air Toxics Standards regulations and people refer to them as MATS for short. The EPA has been the recipient of numerous lawsuits because of MATS. A major concern in the lawsuits was the lack of cost benefit analysis in EPA’s determination to regulate mercury and other toxins released by power plants. EPA estimated the pollution controls in MATS would cost $9.5 billion to implement annually, while the regulation only identified $4 to 6 million a year in environmental and health benefits as a result of reducing mercury and other toxins. EPA also noted additional benefits would occur as a result of the pollution controls reducing sulfur dioxide and particulates. Sulfur dioxide and particulates are not considered toxins under MATS. They are regulated elsewhere in the Clean Air Act. Benefits of reducing additional sulfur dioxide and particulates through the implantation of MATS pollution controls were estimated to be $39 to 90 billion a year.


The lawsuits finally ended up in the Supreme Court and a decision was made by the Supreme Court justices last year. In their ruling, the Supreme Court noted the lack of a cost analysis for implementing the regulations and told the Agency it needed to consider cost, including the cost of compliance, before deciding whether regulating mercury and other air toxins is appropriate and necessary. But then the Court said, “it is up to EPA to decide how to account for cost.”


Well the plaintiffs in the lawsuit must have thought they had won big. As I noted in an earlier post a formal cost-benefit analysis would probably take years to conduct during which time industry could seek ways to delay implementation of costly air controls. But EPA was too smart. They looked at the Court’s phrase: “it is up to EPA to decide how to account for cost,” and decided those words did not mean a formal cost-benefit analysis was needed. Instead, EPA decided on a different method to determine if the costs for implementing the regulations  were reasonable. The method evaluated the cost of complying with MATS regulations to the historic annual revenues and expenditures by the power industry and its impact on retail electricity prices. EPA used 2000 to 2008 revenue data. The power industry in the U.S. basically had revenues of $277.2 to $356.6 billion annually during those years. When compared with EPA’s $9.6 billion estimate of annual industry cost to comply with the regulations, it works out the costs are only a small fraction of the industry’s yearly revenue, just 2.7 to 3.5 %. The impact on retail prices of electricity are also small, just 0.3 cents per Kilowatt hour. (And frankly we know it is the electric rate payer who will eventually pay the bill for the regulatory controls.)


EPA published the cost analysis on December 1, 2015 in the 40 Code of Federal Register 63 as the “Supplemental Finding that it is Appropriate and Necessary to Regulate Hazardous Air Pollutants from Coal and Oil-fired Electric Utility Generating Units.” This supplement was commented on by the public. Can you guess what a lot of comments were? Commenters said, “EPA’s preferred approach to considering cost didn’t rationally balance the costs of the rule against the public health and environmental harm identified.”  In other words, those commenters thought EPA’s method was a bunch of hooey and a formal cost-benefit analysis should be conducted. EPA looked at those comments and replied truthfully to them in the Final Supplement released in April 2016. EPA said the Supreme Court had not required the Agency to perform a formal cost benefit analysis but had instead clearly left it up to the Agency to decide how to account for cost. So EPA has determined in its final supplemental Finding: “a consideration of cost does not cause the Agency to change their determination that regulation of mercury and air toxins is appropriate and necessary under the Clean Air Act.”


Well do you think it’s over? No the first lawsuit over the EPA determination was filed April 25, 2016. In the meantime, the regulations are in effect and power plants are already implementing the new pollution controls or switching fuels from coal to natural gas. Is it worth it? In EPA’s supplement they cite the following statistics from 2005. During that year, electric generating utilities released to the atmosphere  50 % of the U.S.’s total man-made mercury emissions, 62 % of the total arsenic, 39 % of the total cadmium, 22 % of the chrome, 28 % of the nickel and 83 % of the selenium.

MethylMercury in Streams

The U.S. Geological Survey issued a stream assessment report in November 2014. It is the first comprehensive look at methylmercury in streams within the United States. Although the Environmental Protection Agency (EPA) has conducted methylmercury assessments of water bodies in the past, their efforts have generally been concentrated on lakes. The Geological Survey report says one in four streams in the United States has fish with methylmercury concentrations exceeding EPA’s criteria for the protection of human health. EPA’s criteria for protecting human health are 0.3 parts per million methylmercury in fish tissue. The Geological Survey also said in their report that methylmercury in fish is the primary cause of fish consumption advisories for waterways.


During their study, the Geological Survey sampled 300 streams in the United States for methylmercury in water and methylmercury in fish. Large mouth bass were one of the fish they collected most for testing. Large mouth bass are what biologist call predator fish. Predator fish eat smaller fish as well as insects, frogs, snakes and other things that live in and on top of the water. From all the fishing shows you see on television, I guess it must be a very popular fish for sports fishermen. I don’t know how tasty it is to eat. But sports fisherman might want to note that in half the sites where the Geological Survey tested large mouth bass, these fish exceeded EPA’s methylmercury criteria for human health protection.


Now you might think: “Well, yeah that is probably in a bunch of streams near major urban centers.” Right? Well actually no. The Geological Survey found that in major contrast to other contaminants like lead, cadmium, arsenic and so on, methylmercury is highest in fish in undeveloped areas. The reason why methylmercury is highest in fish in rural areas is because of how methylmercury is formed. Mercury is converted into methylmercury via biotic degradation. In other words biota, like microbes and bacteria are taking up the mercury and converting it into methylmercury as they process organic material in the water. This conversion of mercury to methylmercury goes on wherever you have degrading organic material, but wetlands are kind of the hot bed of action for this process. Think about it, you have vast stretches of marsh grasses that die and then are replenished with new grass. These decaying grass mats can be really thick. You’d know this if, like me, you’ve ever waded into a wetland with some of those nutty guys who study coastal processes. Wetlands I can attest have deep organic muck. Wetlands also have something else these microorganisms like. They have very limited dissolved oxygen. These tiny little microbes reduce sulfate and low oxygen zones are where they live. So if an environment has lots of sulfate, then expect lots of these microorganisms and lots of methylmercury. Other environments that host these microorganisms include areas where water levels fluctuate, like in areas that are dammed or areas that flood a lot.


So any water basin with lots of wetlands is most likely to have higher methylmercury in fish. That is why most urban streams don’t have a lot of methylmercury. The wetlands in the urban environment have mostly been destroyed over the years. Let’s not let out a collective hurray for the lack of wetlands. Wetlands produce all sorts of other good ecosystem function, like filtering water and providing habitat and food for animals. It would be better to just keep the mercury from getting into the wetland. The only way to do that is to reduce the source of mercury. Most of the mercury in wetlands is being deposited there from the air and mercury gets in the air due to all sorts of human activities, for example burning coal in power plants.


One of the most noteworthy observations in the Geological Survey stream assessment was that the amount of actual inorganic mercury in a stream was not the driver for how much methylmercury there would be in fish. The Geological Survey looked at a number of streams in historic mining areas where mercury in the sediment and water is thousands of times greater than unmined areas. Because many of these streams have little organic material or wetlands, there is very little methylmercury in the fish. That is how important organic material and the microorganisms that degrade it are to the production of methylmercury.

The Mercury Cycle

I thought a long time about the title of this post. At first I wanted to name it “Up in the Air” then I thought maybe “What Goes Up Must Come Down and Then Go Up Again”. But I stuck with the dull title of “The Mercury Cycle” because it is a clear presentation of how mercury acts in the environment. Everybody has heard of cycles: the cycle of life, the lifecycle of a product, lifecycle management, the lunar cycle. Well mercury has a cycle too. The mercury cycle is like a merry go round that never stops.

Before I write about the mercury cycle, I need to discuss metal species. Everybody has heard of species: plants have them, animals have them. We talk about the human species. Well metals have species too, but it is different. When scientists talk about metal species they are often talking about their oxidation state. We have to look back at our basic knowledge gained over the years, whether from a classroom or a Discovery channel special. You know everything is made up of atoms and those atoms are made up of electrons, protons and neutrons. You’ll maybe not remember but the electrons are the ones that are kind of special and exchange themselves to other atoms. Oxidation means that an atom is losing electrons. There is a complimentary process called reduction used to describe the other atom that is gaining the electrons. These exchanges go on at the molecular level too (remember molecules are a bunch of atoms). Mercury has only a few of these types of species. They include elemental mercury that hasn’t undergone any electron exchange and then the mercurous and mercuric forms of mercury which have lost electrons. Mercuric is the mercury that is most common. You will see it described as Hg (II). Hg is the periodic symbol for mercury by the way. People also talk about metal species when a metal bonds with another element. Again it is those crazy electrons who also share themselves between two elements. Mercury bonds with a lot of different elements, especially other metals. But when it comes to the mercury cycle, the species in which scientists are most interested are the ones where mercury bonds with sulfur and carbon. These mercury species are things like mercury sulfide and when you throw in a little hydrogen with some carbon you get your methylated mercury, including methylmercury, ethylmercury, dimethylmercury and so on. People refer to mercurous and mercuric forms of mercury and mercury sulfide as inorganic mercury. People refer to the methylated mercury as organic mercury.

Okay enough for basic chemistry. That is as far as I am going on that subject. It is a lot more complex but I wanted to tell you about metal species because they will play a role in the mercury cycle story.

The story begins with the release of mercury into the atmosphere. This can come from natural sources since mercury is everywhere in the environment to some extent. It is part of the earth. It is in our rocks and therefore our soils and when soils are eroded mercury goes into our streams and out to the oceans. So there is a natural occurrence of mercury in the environment. As mentioned in a previous post, mercury vaporizes at pretty low temperatures. Heat it up to like 357 degrees Centigrade and it boils. It has, I believe, the lowest boiling point for a metal. So natural mercury is being released to the atmosphere all the time, but at really, really low levels. Now add in your average human being who is interested in being warm in the winter, cool in the summer; who is in need of medical care; wants to put the trash out instead of letting it fill the house; and wants to be able to have nice white clothes and a safe drinking water supply free of bacteria. In other words, a person interested in living a modern existence. Now you start getting man-made sources of mercury in the atmosphere through the burning of coal, medical and trash incinerators, and chlor-alkali plants that are producing chlorine and other chemicals associated with the modern existence.

Mercury in the atmosphere is mostly in three forms: gaseous elemental mercury, the mercuric form, and particulates. The elemental form of mercury can be oxidized in the atmosphere, which results in even more of the mercuric form. Here’s the “what goes up must come down” portion of this post. Mercury comes down in the rain and snow. This is what is known as wet deposition. Mercury also just falls out of the air. Sure there is gravity involved but as usual it’s a lot more complicated. I’m not going into it, because I would have to explain Brownian motion and whole lot of other things. Just know that it is occurring and that it is called dry deposition.

The mercury falls on the ground and in the water. Mercury has a variety of things it can do.  In the ground it can get tied up in the soil thanks to all that organic matter. Or it can run off into the water or percolate down into the groundwater. If the soil is eroded, mercury can enter surface water that way too. Or it can enter surface water directly through wet or dry deposition.

Now that mercury has entered the environment from man-made and natural sources it can immediately get back into the mercury cycle and return to the atmosphere, it can get frozen into a great big glacier, it can get all tied up with the organic material in soil, it can float around in the water (although mercury is not very soluble), or it can settle down in the sediment. When it settles down in the sediment, mercury can undergo methylation if the right conditions exist. The methylation process results in methylmercury. Remember methylmercury is the bad stuff. Methylmercury is taken up by algae and bacteria then ingested by invertebrates living down there in the gunk. Algae and invertebrates are eaten by fish. Methylmercury is accumulated in fish tissue. Birds, animals and people eat fish. Not all birds, animals and people, but osprey, eagles, minks, otters and people along the coasts and lakes are usually chowing down on them. Hey I found a fish in my back yard that an osprey must have dropped! The ants were eating it, so you could probably include insects too.

Fish

There has been a lot of research going on in the past few years on how methylmercury is formed in the environment, but one of the interesting things I have read about is that methylation and demethylation can be going on in the same water body. So mercury is not tied up for all time as methylmecury but can get right back into the mercury cycle.

Now you have the low down on the mercury cycle – not a like a uni-cycle or a motorcycle – but a cycle that needs balance none the less. If humans continue to add to the mercury cycle, there could be a terrible wreck.

Supreme Court Makes Decision on the Environmental Protection Agency’s Mercury Air Toxics Standards Regulations

You don’t often find anything amusing about Supreme Court decisions. They are usually laced with stuffy legal language on prior court decisions and how it applies to a case, but every once in a while you can get a good laugh. And that is the case in the June 29, 2015 Supreme Court decision on Michigan et al. versus the Environmental Protection Agency (EPA). You may recall that this case is a result of a bunch of state governments and industry groups suing the EPA over the Mercury Air Toxics Standards Regulations issued back in February of 2012.

The regulations basically imposed pollution controls on power plants to reduce mercury emissions. The lawsuit was over the fact that the EPA didn’t consider the costs of health and environmental benefits achieved by the regulation versus the cost to industry for complying with the regulation. The cost of the regulation to industry was estimated at $9.6 billion a year. The EPA only conducted a partial cost benefit for reduction of mercury that established a yearly benefit of $4 to 6 million a year. Additional benefits for reduction of sulfur dioxide and particulates would occur as a result of the pollution controls and those were estimated to be $39 to 90 billion a year. But the EPA didn’t use those figures or any others in determining under their Clean Air Act authority that they should regulate power plant mercury emissions.

In deciding the case, the Supreme Court looked at the Clean Air Act which says: the EPA must conclude “regulation is appropriate and necessary” after studying hazards to public health posed by power plant emissions. The Court found that the agency considered regulation “appropriate” because mercury poses a risk to health and the environment and because pollution controls exist to reduce mercury. The agency also found the regulations “necessary” because other Clean Air Act regulations did not eliminate the risk of mercury. The Court held that the EPA interpreted the Clean Air Act unreasonably when it deemed cost irrelevant to the decision to regulate, because the Clean Air Act specifically required power plants to be treated differently from other sources (other sources don’t require a cost benefit analysis to regulate). The Clean Air Act specifically required a cost study for the regulation of power plants.

The Supreme Court decided that the EPA must consider cost, including the cost of compliance, before deciding whether the Mercury Air Toxics Standards Regulation is appropriate and necessary. But the Court said it is up to EPA to decide how to account for cost.

Good grief! All this decision does is “kick the can down the road.” Now the EPA must go back and do the full calculations of the regulations benefits. EPA even stated in the regulations that their calculation of $4 to $6 million was only a partial cost analysis based on IQ loss of recreational fishermen who caught and ate mercury contaminated fish. EPA acknowledged that this was a small subset of the overall benefits of reducing mercury. Now the EPA will have to engage in a much longer and more expensive cost analysis. The analysis will have to show the economic benefits to not only human health but the environment as well. That includes impacts to wildlife like ospreys and eagle, minks and otters, and the many other animals that eat a lot of fish. They will have to look at reproductive and other impacts to the fish themselves. EPA will also have to look at subsistence populations who regularly eat fish and to the population at large who are eating fish from mercury impacted waters. And will the decision to regulate based on the cost benefit study change? I doubt it. If you start looking at impacts to wildlife and fisheries including reduction of recreational uses of streams with consequent losses to local economies and impacts to the fishing industry, well you are going to get an enormous figure. Add on top of that the cost of the side health benefit for the easier to calculate reductions in sulfur dioxide and particulates and I would expect the annual benefits to be in maybe the trillion dollar range.

I thought to myself, surely these state governments and industry groups thought about this in advance before they took this case all the way to the Supreme Court. Of course this is all handled by the lawyers and they may not know much about the cost calculation of damages to health and the environment, but they have scientists on staff who should be very well aware. That’s when I started laughing. Of course they must have known. Maybe all they were doing in taking this case to court was fishing for a delay in implementation of the regulations.

Global Man-made Mercury Contributions to the Atmosphere

I had a conversation the other day with a friend of mine who is an environmental attorney. I was telling her about the Environmental Protection Agency’s regulations to reduce mercury emissions from coal burning power plants. Her area of legal expertise is not air regulation so it was news to her that the Environmental Protection Agency had written and issued the regulations. Actually her area of expertise is international environmental law. She asked me a very logical question coming from someone who has a global perspective. What portion of global emissions is coming from the U.S. compared to countries like China who burn lots more coal than the U.S. and who have about zilch in the way of emission controls. I said mercury emissions from the U.S. are pretty small in comparison to the industrializing countries like China and on top of that the largest mercury air emissions are actually coming from small gold mining operations in Africa and South America. Yes, can you believe it? It is the 21st century and yet these mostly unregulated and often illegal mining operations are still using mercury to produce gold.

Go back to my previous blog post on “Where is All This Mercury Coming From?” and take a look at the chart showing mercury emissions over the last couple of hundred years. You will notice a big old slug of mercury air emissions between the years of 1850 to 1884. Those were the years of the Gold Rush. If you are an American, you will probably have studied the Gold Rush in school. The famous location where it all started was Sutter’s Mill on the South Fork of the American River in Coloma, California. James Marshall’s discovery of gold in the South Fork at Sutter’s Mill in 1848 is an iconic event in American History and Sutter’s Mill is now a California State Park. The event set off gold fever in the U.S. and thousands of people migrated west to try their luck at getting rich by mining gold. History books even have a name for these migrants – the 49ers. Yes, San Francisco named their football team after a bunch of gold miners.

As we have seen, mercury is a unique metal with some highly unusual properties. One of these properties is that it binds readily with other metals in what is called an amalgam. The 49ers learned pretty quickly that mercury was the perfect way to extract gold from the river sediments and the rock and soils they washed out of the Sierra hillsides through hydraulic mining. They washed the gold through mercury lined sluices and over mercury coated metal plates the size of houses. Mercury from these gold extraction processes can still be found today in the American River. Fortunately the use of mercury in gold extraction was replaced by another toxic favorite – cyanide. Cyanide has its problems but at least it degrades rapidly. Mercury is forever.

I took a look at the United Nations Environment Programme report “Global Mercury Assessment 2013: Sources, Emissions, Releases and Environmental Transport.” According to the report, small gold mining operations are now the largest source of man-made mercury emissions. The U.N. has calculated contributions from world-wide mercury sources to annual mercury emissions. The numbers in the report are from 2010. In 2010 global estimates were 1960 tons of mercury released into the air. Seven hundred and twenty seven tons of the mercury came from small gold mining operations. That is 37 percent of all mercury emissions. Worldwide in 2010 only 475 tons of mercury came from burning coal in power plants. Sure that is a big figure too. Twenty four percent of all annual emissions in 2010 came from power plants. It is the second biggest source.

Here’s the answer to my friend the environmental attorney. The whole of North America (remember Canada and Mexico are included in with the U.S.) only contributed 60.7 tons or 3.1 percent of mercury to the global atmosphere. That is from all sources, not just power plants. Even the European Union contributed more mercury to the atmosphere (4.5 percent). What about China. There were not specific numbers for China in the U.N. report, but Asia contributed nearly 50 percent of the global mercury emissions. East and Southeast Asia were 40 percent and South Asia was 8 percent.

Mercury in Coal

I got an email from a reader. They wanted to know why coal has so much mercury in it. In reality coal doesn’t have that much mercury in it. The problem is that you are burning the coal and releasing the mercury into the atmosphere.

Interestingly enough, the smarty-pants at the U.S. Geological Survey have been analyzing coal for years. They have an entire database of coal samples from all over the country. Admittedly, it is somewhat skewed to samples of coal from the eastern United States, but it is the best collection out there.

Mercury is one of the elements for which the Geological Survey has been analyzing the coal samples. Their database includes about 7000 samples of coal. The ranges for mercury in coal are from .003 parts per million to 1.753 parts per million. Eighty percent of coal samples are less than .25 parts per million. The mean coal content is .17 parts per million. (Remember mean is the average – all the mercury values for samples in the database are added up and divided by the number of samples.) Parts per million are milligrams per kilogram. These are very tiny numbers. And that is not even the coal that is going to the power plants. A lot of coal is “cleaned” before it goes to the power plant. Utilities want a good burning coal without a lot of ash and sulfur, so after coal is mined it is often sent through a cleaning process to reduce these unwanted attributes. Ash and sulfur are unwanted because the United States Environmental Protection Agency has regulations to reduce particulates (ash) and sulfur. You don’t want to breathe particulates because they are linked to respiratory problems and you don’t want to have sulfur in the atmosphere. Remember acid rain? Yes sulfur is the big contributor to that problem. The Geological Survey says that 37 percent of mercury is removed by coal cleaning.

When the Environmental Protection Agency wrote their regulations on reducing mercury at power plants, they didn’t rely on the Geological Survey’s database. They conducted a study back in 2010 on mercury content of coals delivered to power plants. I didn’t go looking for this study. The Geological Survey says that the Environmental Protection Agency’s mean mercury content for coal delivered to power plants is .12 parts per million. A bit less than the .17 parts per million the Geological Survey had for their database. The Geological Survey attributed the difference primarily to coal washing and the fact their database had more eastern coal which is higher in mercury than many western coals. Interestingly, the Geological Survey analysis of their database showed Northern Appalachian and Southern Appalachian eastern coals to have the highest mercury content of U.S. coals.

The Geological Survey is doing a lot of research on where mercury resides in coal. I personally thought this was interesting because it was something new to me, so I wanted to share it with you. Pyrite is the source of most of the mercury in coal. You may know pyrite by the term fool’s gold. It is an iron sulfide and often has trace metals like mercury associated with it. Mercury in coal can also be bound to the organic carbon in coal, it can be sort of diffuse as elemental mercury, and it can be part of other minerals found in coal.

Here’s another interesting fact from the Geological Survey. Their database also includes about 1600 coal samples from 57 other countries around the world including China. They looked at the mean mercury content of those samples and found it was 0.16 parts per million, about the same as the mean mercury content of coals in the United States.

Anyway I digress from the main point of my post here which is coal is not teeming with mercury, in fact not any more so than say soils. The same Geological Survey has analyzed soils from all over the country. One of the elements they have analyzed for is mercury. They looked at three different depths of soil. Just looking at the top 5 centimeters of soil, mercury levels ranged from non detectable by current analytic methods to 3.55 parts per million. Soils in the middle part of the U.S. were lower than the soils on the east and west coasts. Again these are really tiny numbers. But we don’t burn soil.

Man-made Emission Sources of Mercury

So why am I writing about mercury? Other than I have a particular interest in it? Well right now the Supreme Court (oral arguments were held March 25, 2015) is looking at a case where the Environmental Protection Agency (EPA) wrote regulations to reduce mercury emissions from power plants and the regulations are being challenged by industry groups. Mercury is coming from power plants? Really?

Yes, really. EPA and industry have done a great job over the last 20 years or so at getting the mercury out. Industrial processes have been changed. Industry has eliminated mercury use in paint and pesticides and reduced its use in batteries. And when was the last time you saw one of those glass thermometers with mercury in it? There is a whole generation now who probably has never seen one. Emissions from municipal waste incinerators, medical waste incinerators, hazardous waste incinerators have all been regulated.

EPA was required under the Clean Air Act amendments in 1990 to study mercury emissions from electric utility generation, municipal waste incineration and other sources. They sent a Report to Congress in 1998 that identified electric utilities as the largest remaining source of mercury emissions to the air.

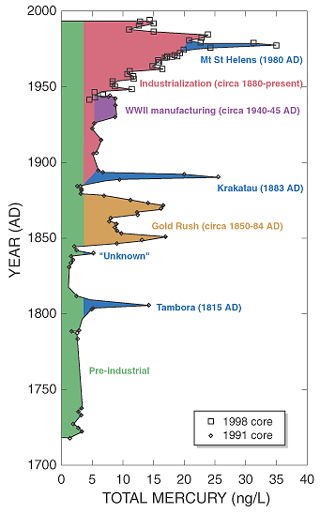
I saw this chart probably about six or seven years ago. It really brought home to me how much mercury there is in the environment now compared to a couple of hundred years ago.

From the USGS Fact Sheet Glacial Ie Cores Reveal a Record of Natural and Anthropogenic Atmospheric Deposition for last 270 Years, FS-051-02, June 2002.
Source: USGS Fact Sheet, Glacial Ice Cores Reveal a Record of Natural and Anthropogenic Atmospheric Deposition for last 270 Years, FS-051-02, June 2002.

The chart is from the U.S. Geological Survey, where collectively in my estimation some of the brightest people on the planet work. The Geological Survey took an ice core from the Fremont Glacier in Wyoming’s Wind River Range. They chose the Fremont Glacier because it was not near an industrial source of mercury and it was in the lower continental United States. Mercury in the air comes down in the rain and in its frozen cousin – snow. So if you drill out a core of ice from a glacier that has accumulated over thousands of years and look at it from top to bottom, you are looking at a record of the amount of mercury there was in snow over time. The Geological Survey didn’t have to analyze for mercury from thousands of years ago, they just had to look back a few hundred years to the 1700’s. As you can see for yourself, other than a big volcanic event (volcanoes eject all sorts of ash and gases into the air including mercury) prior to 1850 there was a lot less mercury in the environment than there is today. The Geological Survey says mercury levels are 20 times higher today than they were in pre-industrial times. You can see that after 1950 mercury levels really hit their highest point. But wait a minute, it looks like about 20 or so years ago mercury levels starting falling again. That is when EPA and industry starting getting the mercury out.

Now these mercury levels the Geological Survey measured are really, really small amounts, basically they are reporting in nanograms per liter. That is one part per trillion. Think of how small that is. That is like a one dollar bill in a stack of a trillion dollar bills. But remember that in animals, methylmercury bioaccumulates. [I wish dollar bills naturally accumulated too, but unfortunately they don’t.] So a small amount of mercury converted to methylmercury can be a big problem.

The primary type of fuel in the power plants that EPA wants to regulate for mercury emissions is coal. When the Report to Congress came out way back in 1998, EPA gave an estimate of the cost of installing technology to remove mercury emissions at coal burning power plants as 5 billion dollars. Yes billion. Here we are 17 years later. Can you imagine what the figure on installing the technology is now?  I don’t even want to look.

EPA’s Report to Congress estimated the yearly releases of mercury in the United States from all sources as 158 tons. They further estimated that 87 % of these mercury emissions were from combustion sources. Coal fired power plants were 33 % of the 87 %. Municipal waste incinerators, commercial and industrial boilers and medical waste incinerators were the other contributors. Remember municipal waste and medical waste incinerators are now regulated.

But here is another twist in the mercury emission story. Air emissions are global. What that means is the United States is just one country contributing mercury emissions to the atmosphere. Many other countries are contributing through releases from power plants, incinerators and lots of other sources. How much of the mercury from U.S. emissions actually ends up in our waterways and soils? EPA sort of has an answer to that question. They used a model to get the answer. For the model, EPA excluded emissions from Hawaii and Alaska. They used a time period of one year for the model. Of about 142 tons of mercury released into the atmosphere from man made emission sources in the lower 48 states, about 48 tons ended up in the local area surrounding the source. About a half a ton remained in the atmosphere after one year. And approximately 94 tons became part of the global mercury emissions. In other words it was transported elsewhere and ended up in somebody else’s soil or water away from the source. It could have ended up in Timbuktu or maybe the Fremont Glacier in Wyoming.

If you want to read more about the Geological Surveys ice core work at the Fremont Glacier here’s a link: http://toxics.usgs.gov/pubs/FS-051-02/

Effects of MethylMercury

I vaguely recalled the story of Minamata Bay in Japan. It is a classic environmental disaster story. And it involves methylmercury. Much of the data in regard to methylmercury impacts comes from that unfortunate event. I refreshed my memory by going back and looking at the Agency for Toxic Substances and Disease Registry’s documentation of health effects of mercury.

Industrial mercury waste was disposed of in the Minamata Bay during the 1950s and 60s. It formed methylmercury in the bay and was ingested by fish which were then eaten by people in the area. Over a hundred people there died from methylmercury poisoning and just as tragically women exposed to methylmercury during pregnancy gave birth to children with neurologic disorders. In fact methylmercury poisoning has been given the name Minamata disease.

Methylmercury bioaccumulates. What this means in a simple fashion is that methylmercury accumulates in animal tissue. It is not readily expelled from the body of an organism like a fish or a human. It all starts at the bottom of the food chain with organisms that feed in the sediments of a water body where methylmercury forms and accumulates. Those organisms are then eaten by small fish, which are in turn eaten by larger fish, which are then caught and eaten by people.

There were a couple of cases of methylmercury poisoning after Minamata, but Minamata is really when there became widespread concern about methylmercury in the environment and especially in fish. Everyone has probably heard pregnant women should limit their consumption of some types of fish because of the mercury levels in them.

There has been a good bit of research on low level methylmercury exposure. The studies have concentrated on populations that eat a lot of fish. Many of these groups of people live on islands. The studies focus on children. In the cases of Minamata and other methylmercury poisonings, children born to women exposed to methylmercury were sometimes blind, deaf, paralyzed or had impaired mental development. Researchers were looking into whether there is developmental impairment to children born from women who have diets that include a lot of fish. All sorts of tests exist to see if children are developing in a normal manner and the researchers used these. They analyzed the mother’s hair for mercury. Then they tested the children.

I’m no toxicologist so I referred to the National Academy of Sciences report in 2000 (National Research Council Committee of the Toxicological Effects of Methylmercury), on what they thought about the research. In one study, when mothers had higher mercury in their hair (13 – 15 parts per million), there was a link to lower scores on IQ and other tests of mental functions in their children. The other studies seemed a mixed bag to me, but the National Academy of Science report concluded that several of the studies conducted by researchers showed increases of abnormal findings on standardized neurological exams.

There were also animal studies cited in the National Academy of Science report. They found similar effects on neurological development in animals as there are in humans when exposed to methylmercury.  Monkey and mice studies showed Minamata disease symptoms at pretty low daily doses.

I don’t mean to scare anyone about methylmercury in fish. The FDA has an advisory for mothers and young children. They recommend not eating swordfish, tilefish, king mackerel or shark. Shark? Who eats shark? Must be someone. Anyway the FDA says two average meals of fish a week are fine (about 12 ounces) of fish low in mercury like shrimp, light canned tuna, salmon, pollock, and catfish. Here’s a link to FDA’s Mercury Levels in Fish and Shellfish (http://www.fda.gov/food/foodborneillnesscontaminants/metals/ucm115644.htm).

Get the Mercury Out!

Get the mercury out! It just doesn’t sound the same as “get the lead” out does it? But lead and mercury are both heavy metals. They are about the same molecular mass, both grey in color, both widespread in the earth’s crust, both widely used in industrial applications in the past, and both neurotoxins. But one is a solid at room temperature and the other is a liquid.  An engineer told me he didn’t know why I was spending so much time on getting mercury out of the water, because he’d played with it all the time when he was a kid. He’d rolled it over his hands and arms, polished up silver dimes with it, and generally considered that he had no ill effects as a result.

Little did my friend the engineer know (and I don’t know why he never took any chemistry) but mercury volatilizes at room temperature. So he was breathing mercury vapor. Probably not for very long, but still he was getting exposure. I don’t know what the effects of rubbing it all over your skin are, so I checked out the ATSDR fact sheet. ATSDR is the Agency for Toxic Substance and Disease Registry. It is part of the Communicable Disease Center (CDC for short). ATSDR is the environmental health organization. If you want to know something about the effects of a chemical on your health, they are your source. So I checked out the fact sheet and it says generally there is no absorption through unbroken skin.  However, I am not going to recommend that you take up rubbing mercury around on your skin.

I did get a look at what happens to you if you do get seriously exposed to mercury vapor; what they call acute exposure. This would be like in a major industrial setting I expect. Symptoms are corrosive bronchitis with fever and chills, abdominal cramps, diarrhea, central nervous system damage leading to neuropsychiatric disturbances and tremors. Oh and kidney failure, respiratory failure, and death too. Then I took a look at what the chronic effects are. That would be repeated or continuous exposure to breathing low levels of mercury vapors: tremors, anxiety, forgetfulness, insomnia, anorexia, excitement, drooling, fatigue, cognitive and motor dysfunction, muscle atrophy, hyperactive tendon reflexes, irritability, sleeplessness, sweating, severe leg cramps, and a painful peeling rash. Whoa! Sounds like zombie disease doesn’t it?

Anyway, I told my friend the engineer that I wasn’t worried about elemental mercury (the silver liquid) so much, since what we generally are concerned about in the water environment are compounds of mercury. Mercury forms all sorts of compounds with sulfur, oxygen, and chlorine. But the big concern in water is mercury also combines with carbon through a biotic process and produces methylmercury. Methylmercury is a neurotoxin. To tell you the truth I don’t know much about environmental health. Not my area, so I had to go back to ATSDR’s publications to find out what happens when you have too much methylmercury in your diet. They cited the classic case of Minamata Bay in Japan. This is a very sad story. And I’ll write about it in my next post.