
So why am I writing about mercury? Other than I have a particular interest in it? Well right now the Supreme Court (oral arguments were held March 25, 2015) is looking at a case where the Environmental Protection Agency (EPA) wrote regulations to reduce mercury emissions from power plants and the regulations are being challenged by industry groups. Mercury is coming from power plants? Really?
Yes, really. EPA and industry have done a great job over the last 20 years or so at getting the mercury out. Industrial processes have been changed. Industry has eliminated mercury use in paint and pesticides and reduced its use in batteries. And when was the last time you saw one of those glass thermometers with mercury in it? There is a whole generation now who probably has never seen one. Emissions from municipal waste incinerators, medical waste incinerators, hazardous waste incinerators have all been regulated.
EPA was required under the Clean Air Act amendments in 1990 to study mercury emissions from electric utility generation, municipal waste incineration and other sources. They sent a Report to Congress in 1998 that identified electric utilities as the largest remaining source of mercury emissions to the air.
I saw this chart probably about six or seven years ago. It really brought home to me how much mercury there is in the environment now compared to a couple of hundred years ago.
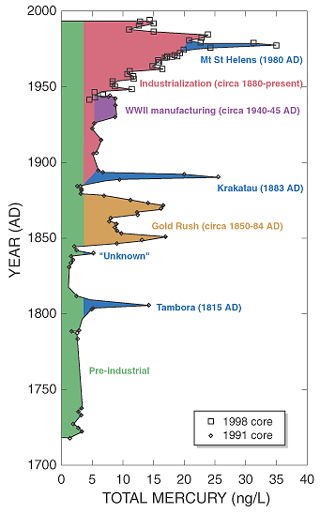
The chart is from the U.S. Geological Survey, where collectively in my estimation some of the brightest people on the planet work. The Geological Survey took an ice core from the Fremont Glacier in Wyoming’s Wind River Range. They chose the Fremont Glacier because it was not near an industrial source of mercury and it was in the lower continental United States. Mercury in the air comes down in the rain and in its frozen cousin – snow. So if you drill out a core of ice from a glacier that has accumulated over thousands of years and look at it from top to bottom, you are looking at a record of the amount of mercury there was in snow over time. The Geological Survey didn’t have to analyze for mercury from thousands of years ago, they just had to look back a few hundred years to the 1700’s. As you can see for yourself, other than a big volcanic event (volcanoes eject all sorts of ash and gases into the air including mercury) prior to 1850 there was a lot less mercury in the environment than there is today. The Geological Survey says mercury levels are 20 times higher today than they were in pre-industrial times. You can see that after 1950 mercury levels really hit their highest point. But wait a minute, it looks like about 20 or so years ago mercury levels starting falling again. That is when EPA and industry starting getting the mercury out.
Now these mercury levels the Geological Survey measured are really, really small amounts, basically they are reporting in nanograms per liter. That is one part per trillion. Think of how small that is. That is like a one dollar bill in a stack of a trillion dollar bills. But remember that in animals, methylmercury bioaccumulates. [I wish dollar bills naturally accumulated too, but unfortunately they don’t.] So a small amount of mercury converted to methylmercury can be a big problem.
The primary type of fuel in the power plants that EPA wants to regulate for mercury emissions is coal. When the Report to Congress came out way back in 1998, EPA gave an estimate of the cost of installing technology to remove mercury emissions at coal burning power plants as 5 billion dollars. Yes billion. Here we are 17 years later. Can you imagine what the figure on installing the technology is now? I don’t even want to look.
EPA’s Report to Congress estimated the yearly releases of mercury in the United States from all sources as 158 tons. They further estimated that 87 % of these mercury emissions were from combustion sources. Coal fired power plants were 33 % of the 87 %. Municipal waste incinerators, commercial and industrial boilers and medical waste incinerators were the other contributors. Remember municipal waste and medical waste incinerators are now regulated.
But here is another twist in the mercury emission story. Air emissions are global. What that means is the United States is just one country contributing mercury emissions to the atmosphere. Many other countries are contributing through releases from power plants, incinerators and lots of other sources. How much of the mercury from U.S. emissions actually ends up in our waterways and soils? EPA sort of has an answer to that question. They used a model to get the answer. For the model, EPA excluded emissions from Hawaii and Alaska. They used a time period of one year for the model. Of about 142 tons of mercury released into the atmosphere from man made emission sources in the lower 48 states, about 48 tons ended up in the local area surrounding the source. About a half a ton remained in the atmosphere after one year. And approximately 94 tons became part of the global mercury emissions. In other words it was transported elsewhere and ended up in somebody else’s soil or water away from the source. It could have ended up in Timbuktu or maybe the Fremont Glacier in Wyoming.
If you want to read more about the Geological Surveys ice core work at the Fremont Glacier here’s a link: http://toxics.usgs.gov/pubs/FS-051-02/